
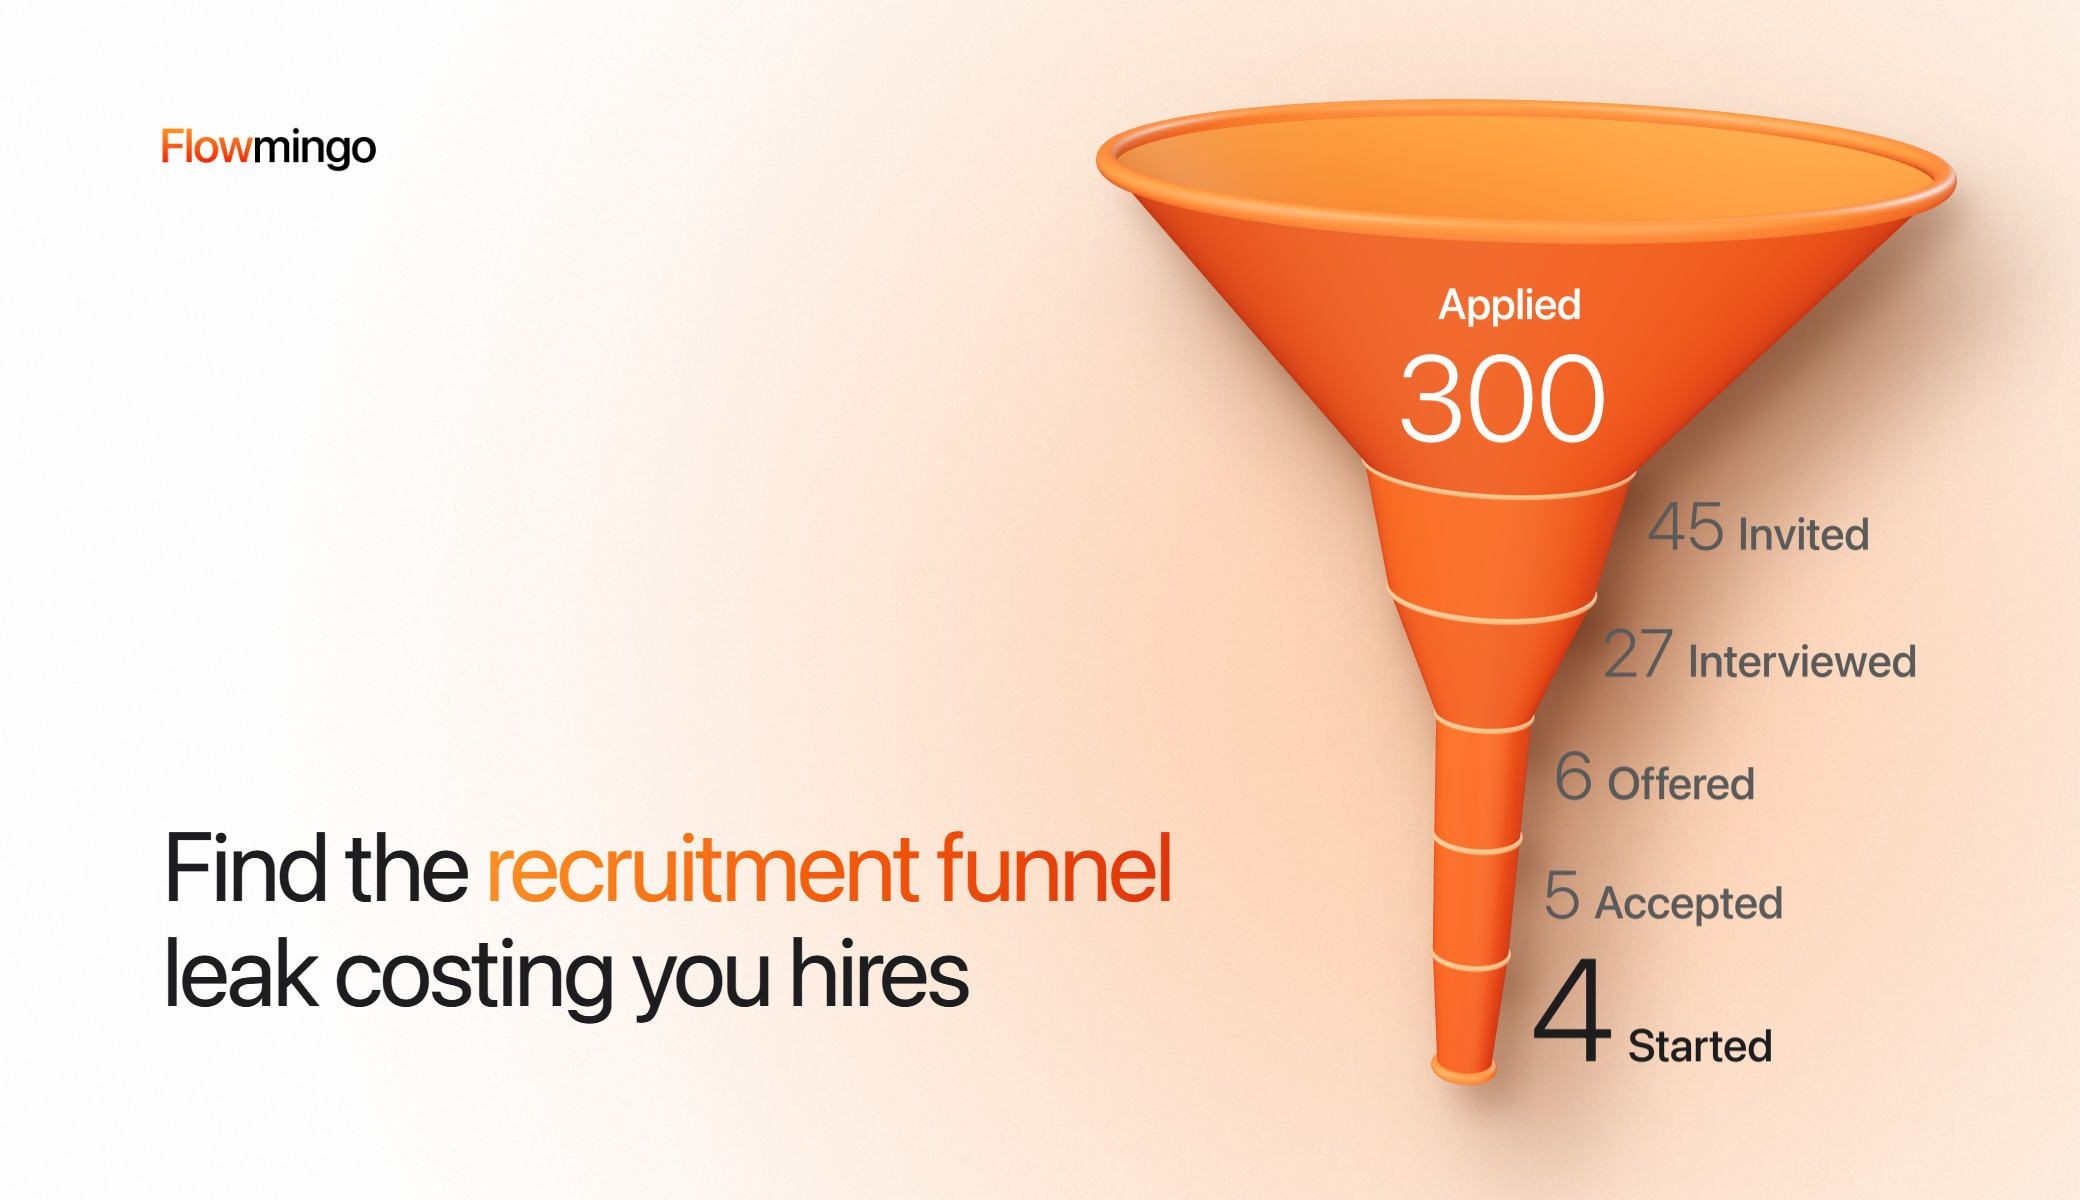
Your recruitment funnel says 300 people applied and 4 started, and your boss asks where the other 296 went. You have totals and no stage rates, so every answer is a guess.
Most guides draw the recruitment funnel stages from awareness to hire and stop there. The published benchmarks mix definitions, so a 3% in 1 report and a 15% in another look like a market gap.
That is how you end up rewriting the job ad while the real leak sits later. In the worked role below, 18 of 45 invited people never came, and a better ad would not have won them back.
Here it is in 3 moves. Count 6 stages from applied to started, set your rates against named benchmarks, then rank each leak by the starts it costs you.
Key takeaways
- How do I find the biggest leak in my recruitment funnel? Divide each stage by the one before it, then count the people who left on their own, not the ones you rejected. In the worked role, 18 of 45 invitees never came.
- Can I compare my stage rates with a published benchmark? Only if the stage means the same thing. The 5 sources in section 2 put first-stage rates at 3% to 14.98%, and 2 of them put interview to offer at 7.3% to 40.45%, most likely because they count different steps.
- Is a stage with only a few people a real leak? Not on its own. With 6 people at a stage, 1 decline is 16.7%, but the true rate could sit anywhere from 3% to 56%.
- How many applicants drop out when I add an AI interview step? Of 52,078 invited to a Flowmingo AI interview, 36.3% began within 14 days and 85.1% of those finished. With no live-interview comparison, that shows where invitees stop, not what the AI step costs.
- Which leak should I fix first? The one that wins back the most starts for the least work. Halving the 18 no-shows adds about 1.3 starts, more than all the other leaks together.
1. How do I build a recruitment funnel, from applied to started, with real conversion math?
Count 6 stages from applied to started, and write down who enters each one. Then divide each stage by the one before it: in the worked role below, 300 applicants gave 4 starters.
Most guides draw 5 to 7 stages, and none we read counts the first day worked. Yet the seat stays empty until that day, so "started" gets its own line.
| Stage | Who counts |
|---|---|
| Applied | Finished an application |
| Invited | Passed your knockouts and CV bar, got an invite |
| Interviewed | Came to the first interview, or finished the AI interview |
| Offered | Received an offer |
| Accepted | Said yes, in writing |
| Started | Worked a first day |
Say you hire 4 Operations Coordinators for a new site (illustrative example, not customer data). Of 300 applicants, 45 get an invite, 27 come, 6 get an offer, 5 accept and 4 start. You offered 6 people for 4 openings, expecting some to say no.
| Stage | Entered | Moved on | Stage rate | Your decision | Left on their own |
|---|---|---|---|---|---|
| Applied to invited | 300 | 45 | 15.0% | 251 | 4 |
| Invited to interviewed | 45 | 27 | 60.0% | 0 | 18 |
| Interviewed to offered | 27 | 6 | 22.2% | 20 | 1 |
| Offered to accepted | 6 | 5 | 83.3% | 0 | 1 |
| Accepted to started | 5 | 4 | 80.0% | 0 | 1 |
| Applied to started | 300 | 4 | 1.33% | 271 | 25 |
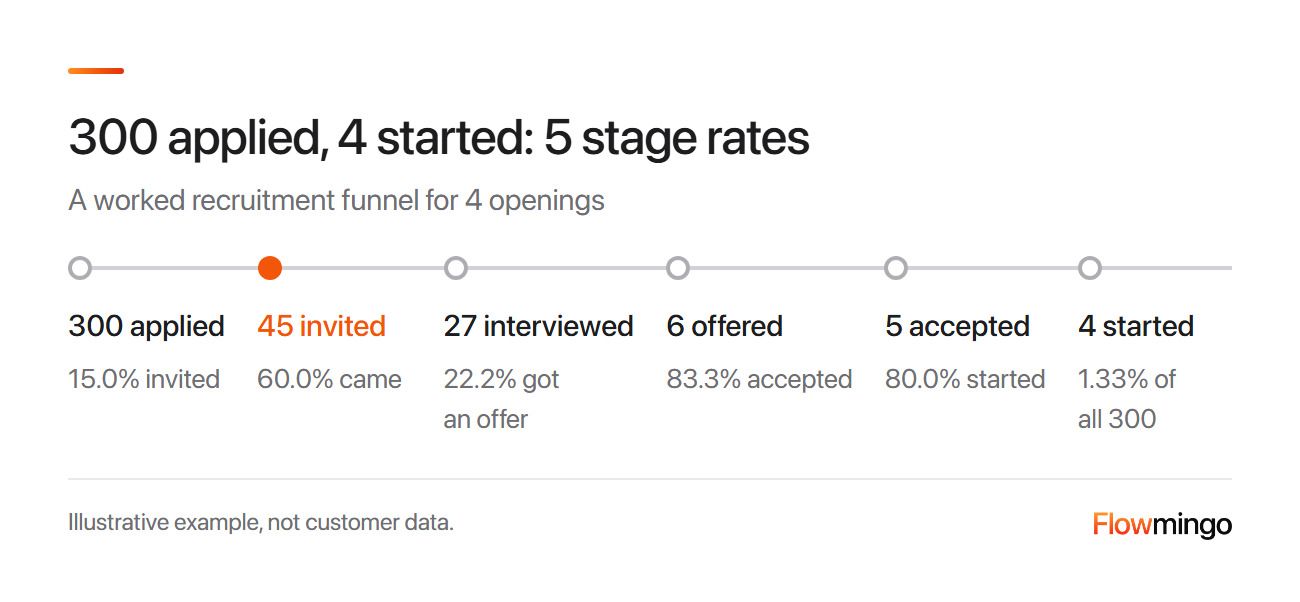
Worked funnel: 300 applicants gave 45 invites (15.0%), 27 interviews (60.0%), 6 offers (22.2%), 5 acceptances (83.3%) and 4 starts (80.0%), 1.33% of all 300.
A stage rate is the people who moved on divided by those who entered, withdrawals included. Our guides to recruiting metrics and hiring process steps hold the formulas and the 8 steps.
1.1 How do I count withdrawals, ghosts and rejections when the ATS has no funnel report?
Log 1 row per candidate, with the columns below. Then split every stage's non-movers into 2 groups, because only 1 of them is a leak.
| Role | Source | Furthest stage | Left on their own or you decided | Why | Date each stage began |
|---|
- Your decision: you rejected them.
- Left on their own: they withdrew, stopped replying, did not turn up, declined the offer or did not start.
Write the ghost rule down once, for example no reply to the invite and 2 reminders in 7 days. It is our rule, not a standard, but it stops 2 recruiters counting the same person differently.
2. Which recruitment funnel benchmarks can I trust, and what stage rates are normal in 2026?
Trust a benchmark only if its stage means the same as yours. 5 sources put first-stage rates at 3% to 14.98%, and each defines the step differently.
Ashby and Appcast put interview to offer between 7.3% and 40.45%. We found no source that explains the gaps, so we read them as different definitions and samples. Read the table as context, not a ranking, because these are vendor customers.
| Stage | Source and years | Sample | Rate |
|---|---|---|---|
| First stage | CareerPlug, 2025 report, 2024 data | 60,000+ small business owners (2024 data, foundational) | 3% applicant to interview |
| First stage | Ashby, Q1 2026 | 109M applications | 3.6% technical, 4.7% business |
| First stage | Gem, 2025 report, inbound | 140M+ applicants | 6% to pre-onsite |
| First stage | Greenhouse, 2025 data | 640M applications | 7.6% at stage 1 (undefined) |
| First stage | Appcast, 2026 report, 2025 data | Nearly 1,200 US employers, median, long-apply and ATS-apply ads only | 14.98% median apply to screen |
| Interview to offer | Ashby, Q1 2026 | 109M applications | 7.3% technical, 10.4% business |
| Interview to offer | Appcast, 2026 report | Nearly 1,200 US employers, long-apply and ATS-apply ads only | 40.45% median |
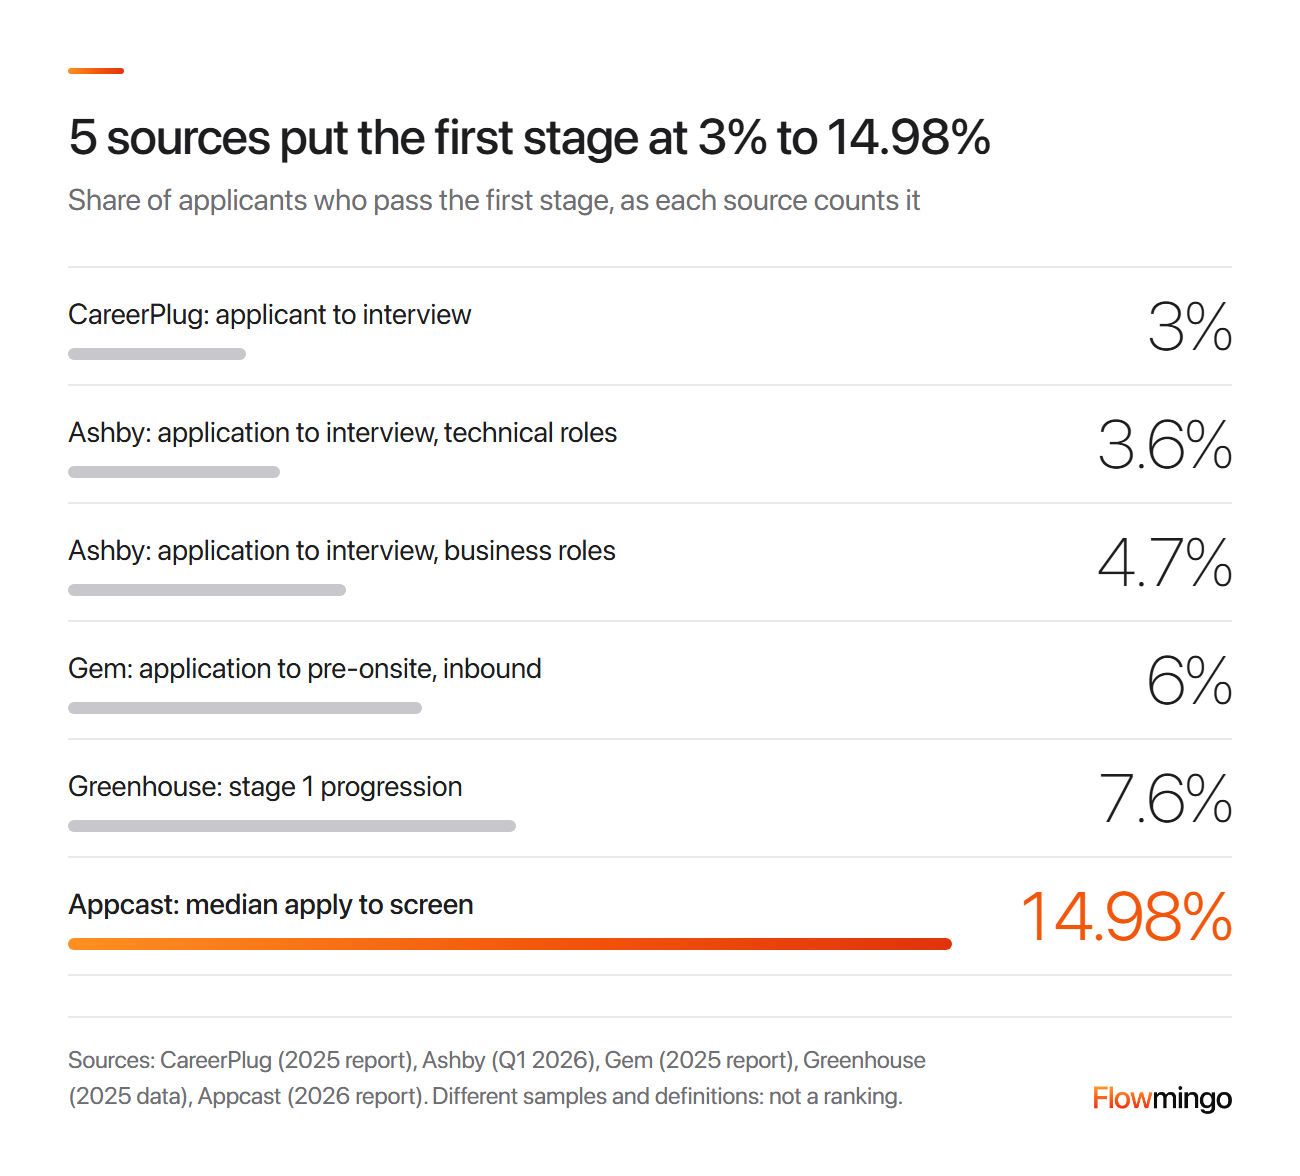
First-stage rates: CareerPlug counts 3% of applicants reaching an interview, Ashby 3.6% to 4.7%, Gem 6%, Greenhouse 7.6% and Appcast 14.98% reaching a screen.
Gem's 2026 report puts the overall rate at 8% past initial screening, and 0.5% of applicants get an offer (Gem).
CareerPlug counts applicants who reach an interview, while Gem counts inbound applicants who reach any step before the onsite. That means a 3% and a 6% are not the same measure, so never rank sources by them. Inside that 2026 report, smaller companies pass 25% to pre-onsite and larger ones under 10%.
Rates do not chain. CareerPlug's 3% applicant-to-interview x 27% interview-to-hire gives 0.81%, yet its report says 180 applicants per hire (0.56%). So use each rate on its own stage.
For an owner-run business, start with CareerPlug, whose sample is small businesses, and always compare by role family. We found no dated benchmark for booked-interview show rates or for accepted offers that start.
3. How do I find the biggest leak in my recruitment funnel by comparing stage-to-stage rates?
Divide each stage by the one before it, then split every loss into people you rejected and people who left on their own. The biggest leak is the stage where the largest share left on their own.
The method is ours, not a published standard. Rank the left-on-their-own share per stage against a benchmark and your last 3 roles.
Here are the recruitment funnel metrics for the worked role (illustrative), with a 95% range for each share.
| Stage | At the stage | Left on their own | Share | 95% range | Read |
|---|---|---|---|---|---|
| Applied to invited | 300 | 4 | 1.3% | 0.5% to 3.4% | Small |
| Invited to interviewed | 45 | 18 | 40.0% | 27.0% to 54.5% | Leak |
| Interviewed to offered | 27 | 1 | 3.7% | 0.7% to 18.3% | Small, under 30 people |
| Offered to accepted | 6 | 1 | 16.7% | 3.0% to 56.4% | Too few to read |
| Accepted to started | 5 | 1 | 20.0% | 3.6% to 62.4% | Too few to read |
Only the second row is a measurable leak. The last 2 rows are too small to read, because their ranges (3.0% to 56.4% and 3.6% to 62.4%) include 40.0%. Treat them as unknown, not fine.
The interviewed-to-offered rate of 22.2% looks low, but you rejected 20 of those 27 people, which is the screen working, not a leak. Totals could not show this, because the biggest absolute loss, 255 people, is the first stage by design.
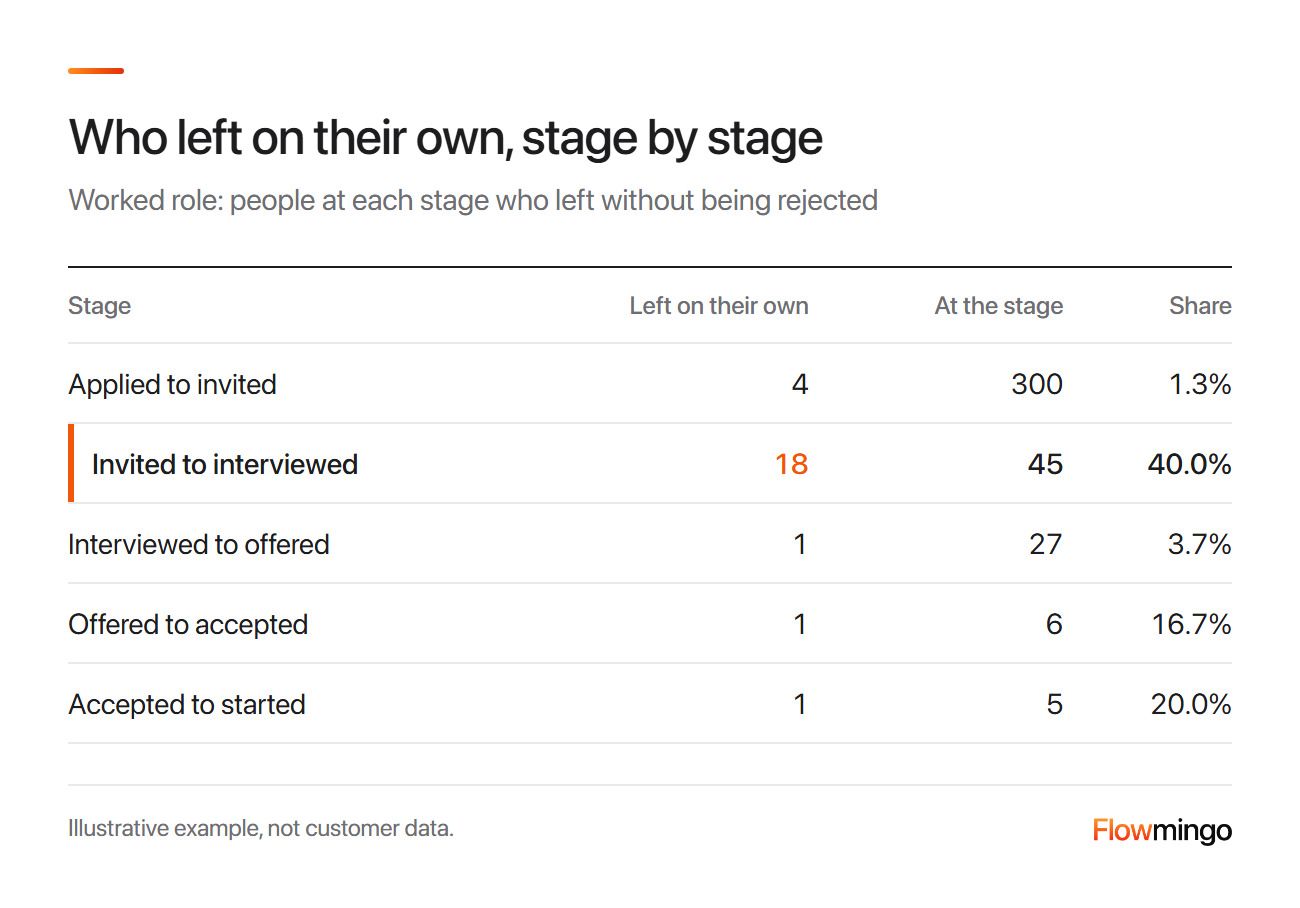
Leak test: 18 of the 45 invited people (40.0%) never came to the interview, the largest share at any stage.
Track days in stage too, because a stall shows in days before it shows in a rate. At 20 new applications a day, a 7-day wait leaves 140 people waiting and a 3-day wait leaves 60 (our arithmetic). Run the same table per role and source, because an average hides the 1 role that leaks.
3.1 Is losing 18 of 45 invited people a real leak or a small sample?
Treat it as real, because its range of 27.0% to 54.5% does not overlap the ranges of the 2 stages next to it. Those top out at 18.3% and 3.4%. We found no published benchmark for the invite show rate, so this is a leak only against its neighbours.
A stage is a leak when its range sits clear of its neighbours' ranges, or of a benchmark that defines the stage the same way. With under 30 people, compare the same stage across 3 or more roles or quarters (30 is our rule of thumb). The range is a Wilson interval, which Brown, Cai and DasGupta recommended in a foundational 2001 paper.
4. 1,000 applicants, 1 hire: is the leak at the top of the funnel or in screening?
Check who applied before you blame the screen. When few applicants meet your must-haves, the leak is the ad, the pay line or the channel.
This test is our rule of thumb: divide the applicants who meet every must-have on paper by everyone who applied. Compare that share with your last 3 roles, not with section 2, because those rates count a different step.
Say 120 of 1,000 applicants met every must-have last time and 30 of 1,000 meet them now. That fall from 12% to 3% points at the ad, the pay line or the channel, not at your screen. If that share held at 12% and you still hire 1 in 1,000, check the screen and later stages with the section 3 table.
A thin top is common. In NFIB's August 2026 survey of 476 member firms, 82% of owners hiring or trying to hire reported few or no qualified applicants.
When the top is the leak, put the pay range and the must-haves in the ad. In a vendor survey by iCIMS, 60% of US hourly frontline workers had started but not finished an application. They cited lengthy forms (50%) and no pay transparency (31%), self-reported, so read those as causes, not a rate.
Add the knockout questions from our guide to pre-screening interview questions, which lists 6 pass-or-fail questions. Pause the posting when the queue holds more than you can read in 5 working days. For example, at an assumed 2 minutes a CV, 600 applicants take 20 hours.
How Flowmingo helps
CV Evaluation turns a pasted job description, or just a job title, into criteria you edit. It scores every CV 0 to 10 with written evidence. Nobody is filtered out automatically: every CV stays in your list and you decide.
5. Why do good candidates drop out between applying and the first interview?
They leave where you ask too much or go quiet: the form and the wait for a reply. Match the fix to the stage, because each cause shows at a different stage of your recruitment funnel.
A foundational 2012 review of 232 studies by Uggerslev and colleagues found recruiter behaviour matters at the first 2 stages and the process itself later.
Start with the form. Appcast's 2026 report shows the apply rate falling from 5.37% for 1 to 5 minutes to 3.09% for 16 or more, across different jobs.
In Talent Board's foundational 2024 survey, 24% of North American candidates were still waiting 2+ months after applying. In the 2025 CandE benchmark, now run by Survale, 31% were not hearing back 1 to 2+ months after applying. The top reason for withdrawing was disrespect for their time in interviews and appointments (32%).
Give every applicant a yes or no within 1 week, and never go 2 weeks without a message (our rule, not a benchmark). If you cannot decide, say so and name the date. Our guides to hiring process steps and candidate rejection email templates hold the messages.
6. Do 4 interview rounds make strong candidates drop out, and which round loses them?
Past 3 rounds the evidence for more is thin, and each round adds days in which someone can leave. We found no source that measures the loss by round, so count it round by round in your recruitment funnel before you cut one.
Rounds cost days. Greenhouse's North American jobs held 22.7 interviews each, and Greenhouse reports 56.7 days to fill in 2025. Gem counts interviews per hire rising from 14 in 2021 to 20 in 2024.
We suggest 3 rounds after the screen, as in our hiring process steps guide: a first interview, a skills test and a final.
A foundational 2017 re:Work analysis from Google found that the scores from 4 interviews predicted the final hire-or-reject call with 86% confidence. That measures agreement with the panel's decision, not how the hires later performed, and it is 1 company's analysis. Use it to question extra rounds.
Fill 1 row per round, per role. For example, if people leaving or days waiting jump at the final interview, that round or the wait before it is the leak.
| Round | Booked | Came | Moved on | Left on their own | Median days since the last round |
|---|---|---|---|---|---|
| First interview | |||||
| Skills test | |||||
| Final interview |
One round on 1 role is a small sample, so apply the 30-person rule from section 3.1 before cutting a round.
7. 5 of 8 booked interviews were no-shows: is that normal, and what do I change?
It may be common, but we found no dated benchmark for the share of booked interviews that show up. Measure your own show rate over 3 roles, then book enough slots to meet your need.
On r/managers, a manager hiring cooks said 5 of 8 interviews booked in 2 weeks did not show, 1 cancelled and 2 came. The recruiter that manager works through phone-screens first and confirms the day before. Those are anecdotes, not benchmarks.
CIPD's foundational 2024 survey found that 17% of the UK employers that recruited said candidates always or mostly cancelled interviews at little or no notice.
Bookings equal interviews needed divided by the show rate. For example, 27 of 45 invited people came in the worked role, a 60.0% show rate, so a role needing 6 interviews needs 10 bookings. At that manager's 25%, 6 interviews need 24 bookings (our arithmetic, not a benchmark).
A confirmation alone did not save those slots, so our suggestion is to also shorten the gap between invite and slot. Our interview invitation email templates add a reminder the day before a live slot and a text 4 hours before.
8. Candidates accept our offers and then don't start: how do I count and cut that loss?
Count it as its own stage in your recruitment funnel: accepted offers divided into starts, with a date between the yes and day 1. In 1 large field experiment, about 73% of accepted offers ended with someone who started and passed training (our arithmetic).
We found no employer benchmark for accepted-to-started. Jabarian and Henkel's pre-registered 2026 working paper followed 5,854 accepted offers at 1 recruitment firm in the Philippines, hiring customer-service staff for client companies.
Of them, 4,294 started the job and passed training. The rest did not start regular work after the mandatory training stage.
CIPD's foundational 2024 UK survey found 14% of recruiting employers saw candidates always or mostly accept, then decline. 27% had at least some experience of offered candidates not arriving on day 1.
Record the accept date and the start date for every offer, and log why each person drops out. No source here splits the accepted-but-gone loss by reason. Our suggestion, not a benchmark: check in 1 week after the yes and again in the week before day 1.
A cancellation that late still leaves time to call your runner-up. Keep the runner-up warm until the finalist signs, as in our hiring process steps guide, because candidates decline nearly 1 in 5 offers (Gem). If accepted offers often fail to start, keep them warm until day 1.
9. If I add an AI interview step, how many applicants drop out of my recruitment funnel?
Most invited applicants never begin the interview, but 85.1% of those who begin finish it. The first card counts 52,078 applicants invited by recruiters, and 36.3% began within 14 days.
If the AI interview is your first interview, it is the invited-to-interviewed step in the 6 stages, and finishing it counts as interviewed.
Flowmingo data · 52,078 applicants invited by recruiters to an AI interview · 866 companies · invites 15 Jun to 13 Sep 2026, each followed for 14 days · Matched Talent invites excluded · as of 28 Sep 2026
- 36.3% of invited applicants began the AI interview within 14 days, and 30.9% finished it.
- 85.1% of applicants who began the AI interview finished it within the 14 days.
- 63.7% of invited applicants never began, so the first step is the biggest step down.
Counts applicants recruiters invited, not all applicants. Finished means completed, not hired. Scores are AI scores against each job's own criteria, not job performance.
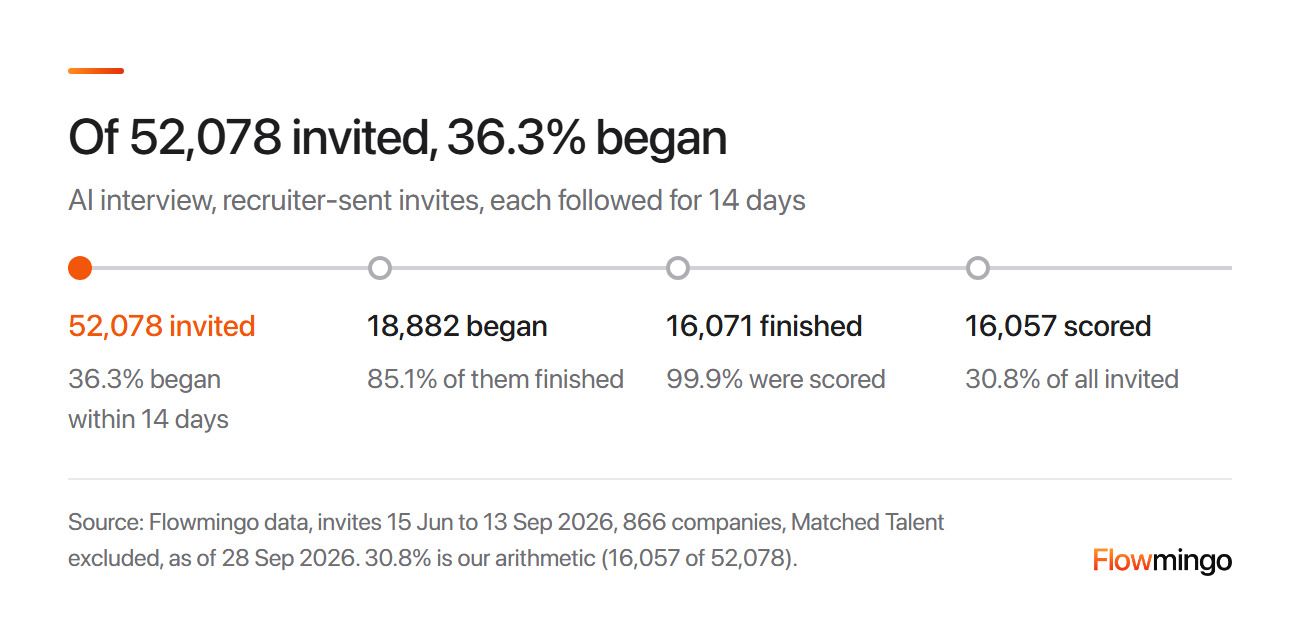
AI interview funnel: of 52,078 invited applicants, 36.3% began within 14 days, 85.1% of those finished, and 99.9% of the 16,071 who finished were scored.
Of the 52,078 invited, 18,882 began, 16,071 finished and 16,057 were scored, which is 30.8% of everyone invited (our arithmetic). The leak sits at the invite, not inside the interview, because 85.1% of those who begin finish.
Flowmingo data · 49,323 AI interviews begun · 990 companies · 24 Jun to 20 Sep 2026
- 85.0% of all AI interviews begun, across devices, were finished.
- 89.2% of AI interviews begun on a desktop or laptop were finished.
- 73.5% of AI interviews begun on a phone were finished, a gap of 15.7 points (full data).
Interviews begun, not invites, so a different base from the first card. Associations, not causes: companies, roles and countries differ by device. Begun means the candidate reached the interview conversation. Finished means completed, not hired.
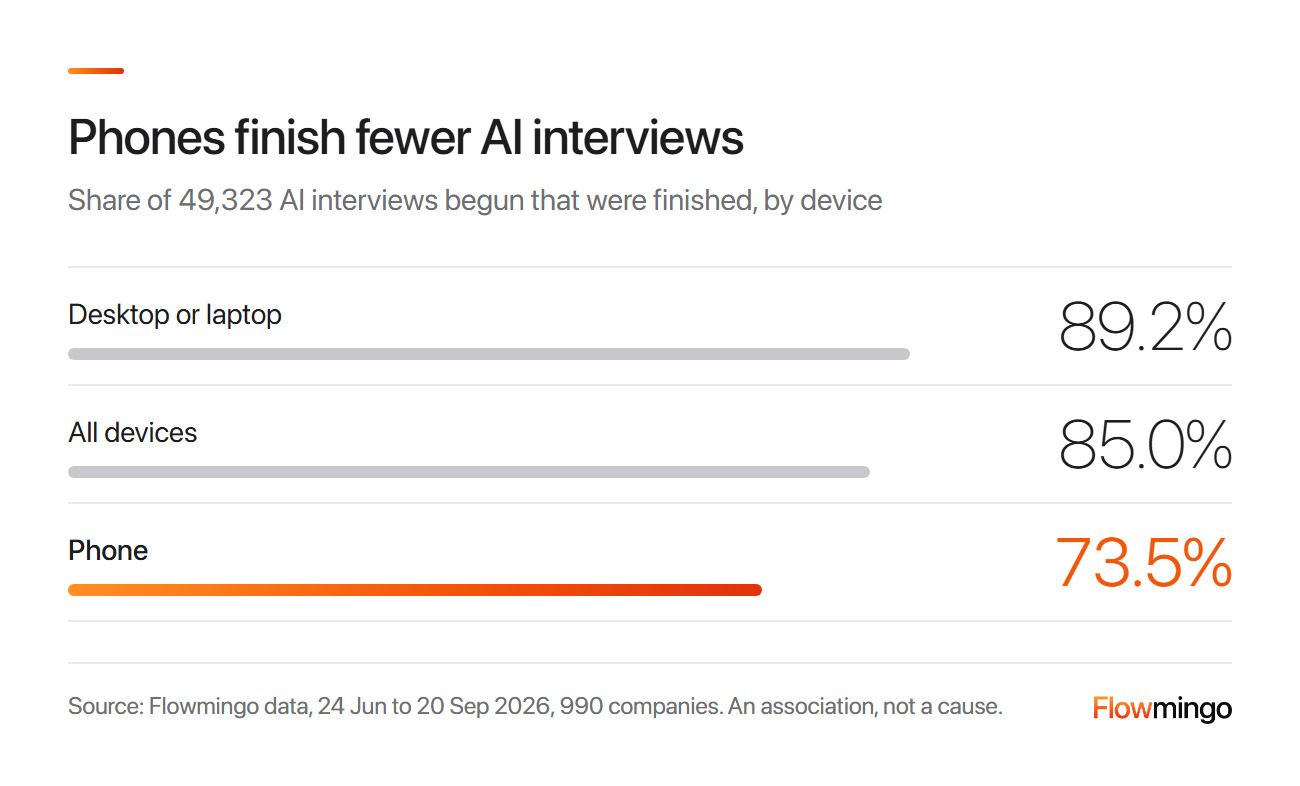
Finish rate by device: of 49,323 AI interviews begun, 85.0% were finished, 89.2% on a desktop or laptop and 73.5% on a phone.
Phone interviews finished less often, an association and not proof the phone is the cause. So tell applicants in the invite how long the interview takes and that they need a camera and a microphone. Our interview invitation email templates hold the invite wording.
In Greenhouse's 2026 survey, 38% of 1,200 US job seekers (of 2,950 across 5 countries) had quit a hiring process over an AI interview. It lists AI-scored video with no human present (33%) and no disclosure (27%) as reasons, without saying they are shares of the 38%. Of those who finished one, 51% never heard back.
A Gartner 3Q25 survey, published in June 2026, found that only 31% of 254 candidates were told in advance their interview would be AI-led. These are self-reported surveys, not measured drop-off.
Candidates leave when no human is visible, when they were not told and when they hear nothing back. So say it is an AI interview and who reviews it.
How Flowmingo helps
Applicants do the AI interview in their own time, with a link, a camera and a microphone, and nothing to book or install. You get the recording, the transcript and a report scored 0 to 10 against your criteria. Who moves forward is always your call. Every assessment lands on 1 profile on a board that filters by assessment, invitation status, score and stage. Flowmingo does not build the funnel report for you.
10. Which leak in my recruitment funnel do I fix first, and did the fix work?
Fix the leak that wins back the most starts for the least work, then re-measure the same stage on your next roles. In the worked role, halving the 18 no-shows adds about 1.3 starts, more than all the other leaks together.
The method is ours, not a published standard. For each leak, halve the people who left on their own and count the extra starts using the later stage rates. It assumes a recovered candidate converts like one who stayed, so it ranks leaks and does not forecast.
The worked role already filled its 4 seats, so read +1.3 as headroom. With the 18 no-shows halved, the same funnel gives about 5.3 starts per 300 applicants. The same 4 starts would need about 225 applicants (4 / 5.33 x 300).
| Leak | Left on their own | If halved, extra starts | Working |
|---|---|---|---|
| No-shows before the interview | 18 | +1.3 | 9 more interviews x 22.2% x 83.3% x 80.0% |
| No-start after accepting | 1 | +0.5 | 0.5 more starters |
| Offer declines | 1 | +0.4 | 0.5 more acceptances x 80.0% |
| Withdrawals before the screen or after the interview | 5 (4 before the screen, 1 after the interview) | +0.1 | 0.03 (2 more applicants) + 0.08 (0.5 more people x 6/26 offered x 83.3% x 80.0%) |
| Subtotal of rows 2 to 4 (the smaller leaks) | 7 | about +1.0 | 0.5 + 0.4 + 0.03 + 0.08 = 1.01 |
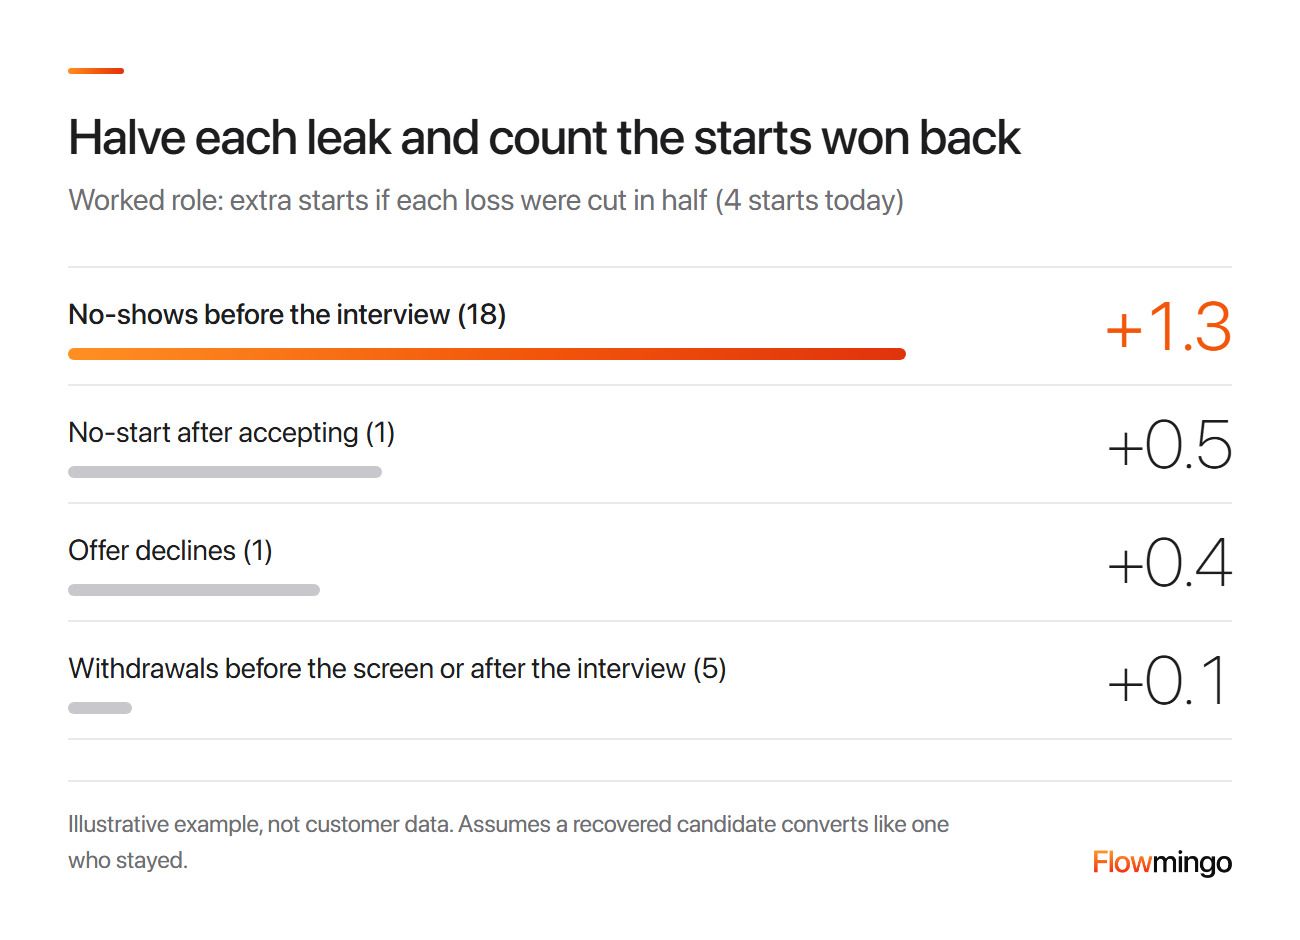
Starts won back: halving the 18 no-shows adds about 1.3 starts, against +0.5 for no-starts, +0.4 for offer declines and +0.1 for withdrawals.
Illustrative example, not customer data. Weigh cost and speed too: a confirmation message costs an afternoon, and a new pay band costs a budget.
To check the fix, re-measure the same stage until you have 30 or more people at it, which can take 3 roles, and compare ranges. For example, 18 of 45 (27.0% to 54.5%) falling to 4 of 40 (4.0% to 23.1%) leaves no overlap, so chance alone is unlikely. A fall to 6 of 40 (7.1% to 29.1%) still overlaps, so keep measuring.
Check that the role, season and channel did not change before you credit the fix.
How Flowmingo helps
Flowmingo is a free AI interviewer for recruiters. Count your recruitment funnel by stage first, then let Flowmingo run the first round.
11. Sources
Every study, survey and benchmark in this guide links to a source below; Flowmingo figures come from Flowmingo's own platform data.
- Appcast (2026). 2026 recruitment marketing benchmark report: U.S. version. Appcast.
- Ashby (2026, April 28). Recruiter productivity. 2026 Talent Trends Report, Ashby.
- Brown, L. D., Cai, T. T., & DasGupta, A. (2001). Interval estimation for a binomial proportion. Statistical Science, 16(2), 101-133.
- CareerPlug (2025). 2025 recruiting metrics report: Benchmark data and by industry. CareerPlug.
- CIPD (2024). Resourcing and talent planning report 2024. Chartered Institute of Personnel and Development.
- Gartner (2026, June 18). Gartner HR research finds 48% of candidates accepted job offers in 4Q25. Gartner newsroom.
- Gem (2025). 2025 recruiting benchmarks report. Gem.
- Gem (2025, December 1). Key takeaways from the 2026 recruiting benchmarks report. Gem.
- Greenhouse (2026, March). The Hire Standard: Greenhouse benchmark report, North America. Greenhouse.
- Greenhouse (2026, May 1). 63% of job seekers have faced an AI interview. Most haven't had a good one yet. Greenhouse 2026 Candidate AI Interview Report.
- iCIMS (2025, September 16). New research reveals frontline hiring is urgent, yet broken processes stall critical roles. iCIMS newsroom.
- Jabarian, B., & Henkel, L. (2026). Voice AI in firms: A natural field experiment on automated job interviews (arXiv:2607.28222v2). Working paper.
- NFIB (2026, September). NFIB small business jobs report, August 2026. NFIB.
- r/managers (2026). No show interviews [Online forum post]. Reddit.
- Shaper (2017). How many interviews does it take to hire a Googler. re:Work, Google.
- Survale (2026, July 21). 2025 candidate experience (CandE) benchmark research: Key statistics. Survale.
- Talent Board (2024, December). What sets CandE award winners apart: 2024 CandE benchmark research. ERE Media.
- Uggerslev, K. L., Fassina, N. E., & Kraichy, D. (2012). Recruiting through the stages: A meta-analytic test of predictors of applicant attraction at different stages of the recruiting process. Personnel Psychology, 65(3), 597-660.