
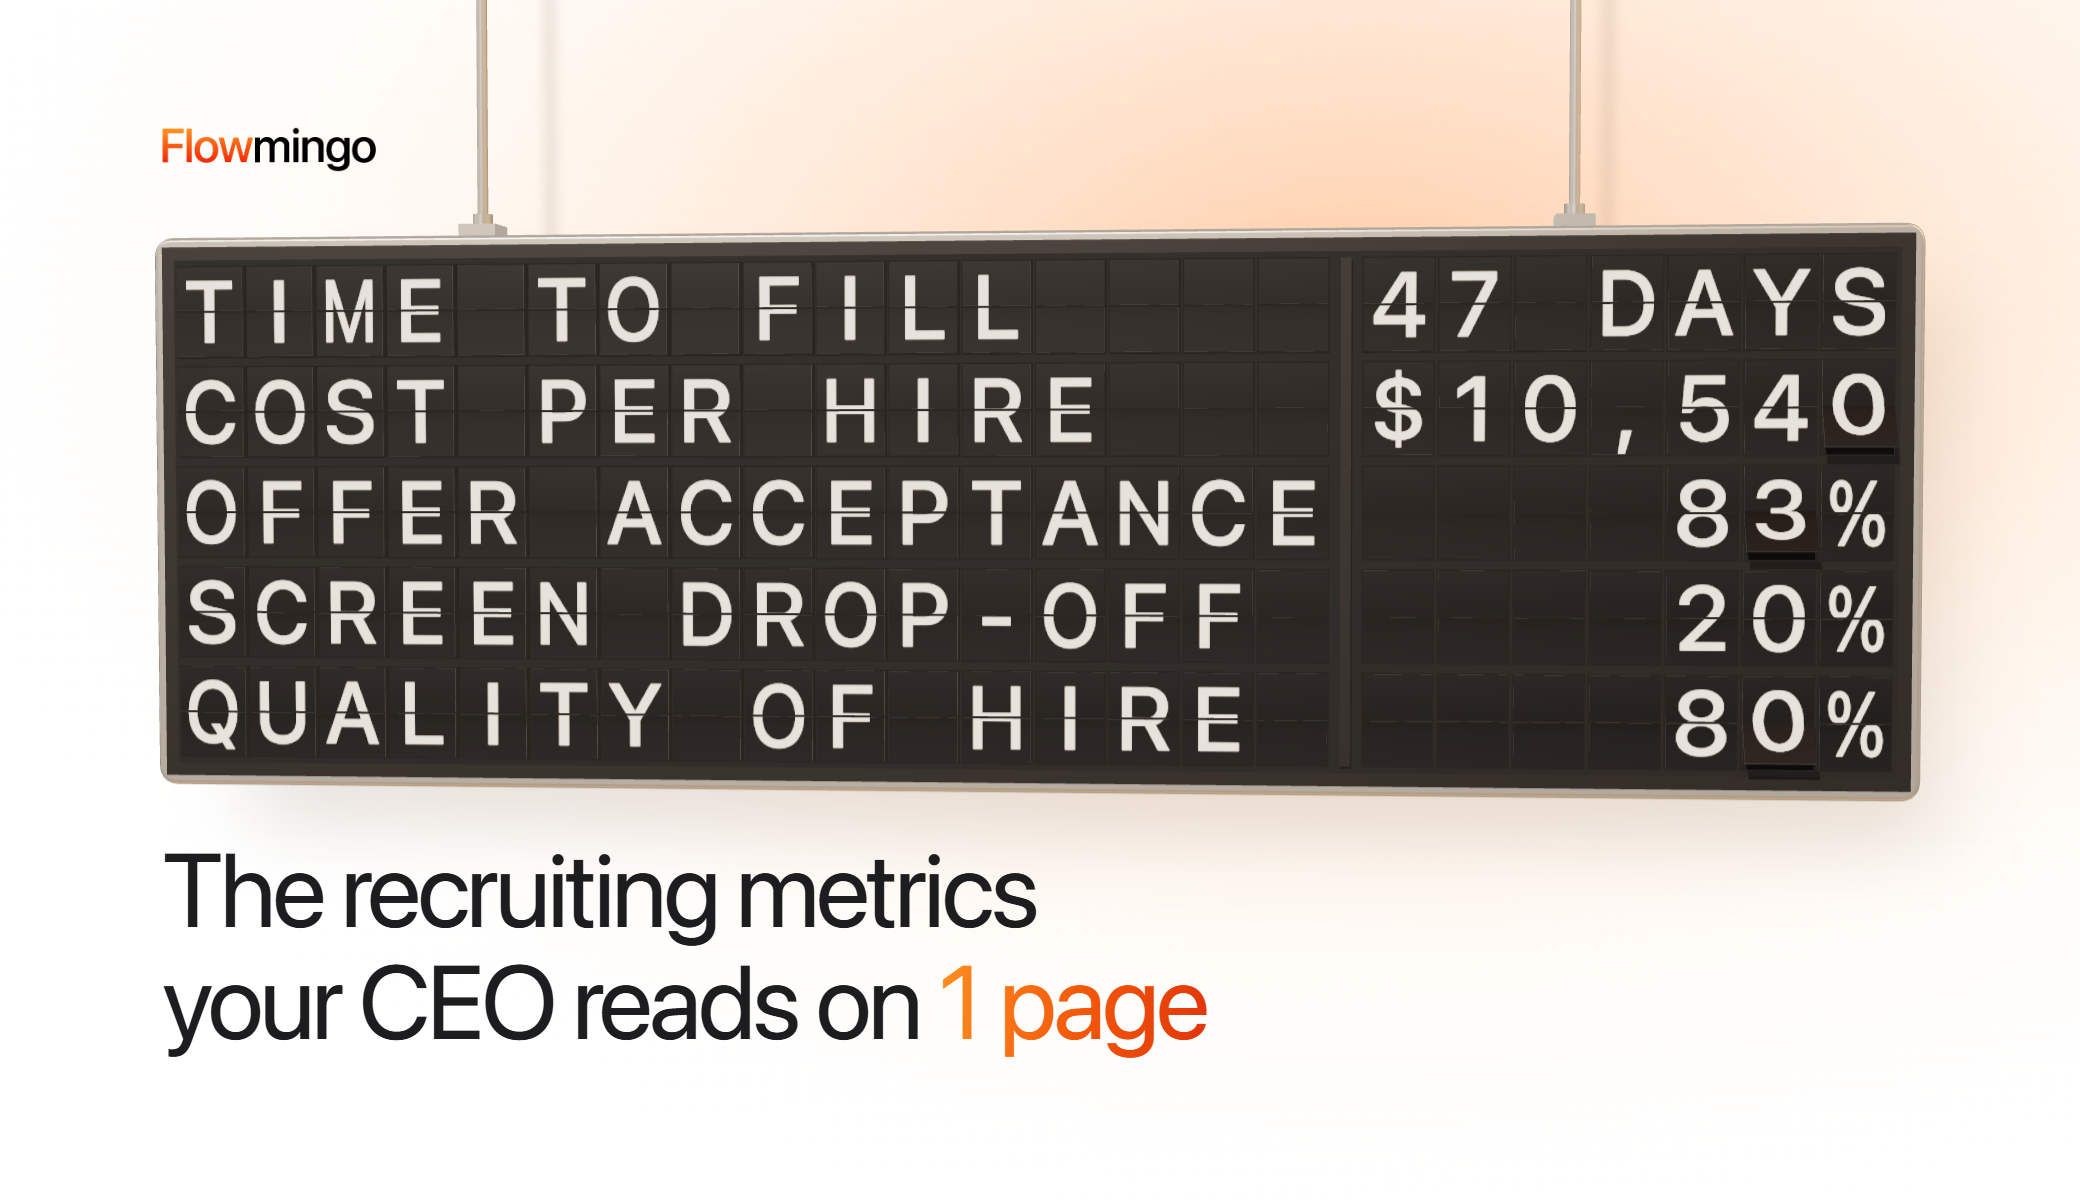
Your CEO wants 1 slide of recruiting metrics by Friday: why the Customer Success role took 70 days, and your cost per hire. You have 2 people on hiring, 5 job boards and a spreadsheet.
Most guides list 13 to 25 metrics and rarely say which ones change a decision. Their benchmarks carry no date, and their cost per hire is an average that big spenders pull up.
So your number is easy to challenge. A board member sets your $10,540 cost per hire against SHRM's $1,244 median and asks why you cost over 8 times as much.
Nothing on your slide shows that 73% of it is fixed pay and tools. So the team may cut the referral channel that made 2 of your 5 hires.
Below: 8 metrics with formulas and dated benchmarks, 1 role worked from 250 applicants to day 90, and a 1-page dashboard.
Key takeaways
- How many recruiting metrics should a small team report to leadership? 8 at most, each tied to 1 decision it changes.
- What is a normal time to fill right now? 39 calendar days, SHRM's newest median for non-executive roles.
- What cost per hire should I compare ours with? SHRM's last public median of $1,244, not the $4,683 average.
- Where do candidates drop out of an interview step? Mostly before they start: of 52,078 applicants invited to a Flowmingo AI interview, 36.3% began within 14 days, and 85.1% of them finished.
- How do I measure quality of hire with only a few hires a year? Check each hire at day 90 against expectations written before the offer, and show counts like 3 of 15.
1. Which recruiting metrics should I report to leadership when my team is 1 to 4 people?
Report 8 recruiting metrics at most, and pick each for the decision it changes. Time to fill, stage conversion, drop-off, hires by source, cost per hire, offer acceptance, interviewer hours and day-90 quality of hire cover it.
Every line on a leadership page should prompt an action. Ranking guides list up to 25 metrics, and only Recruiterflow advises 5 to 8, for agencies. Keep the rest in your working sheet.
A metric becomes a recruitment KPI once it carries a target someone owns.
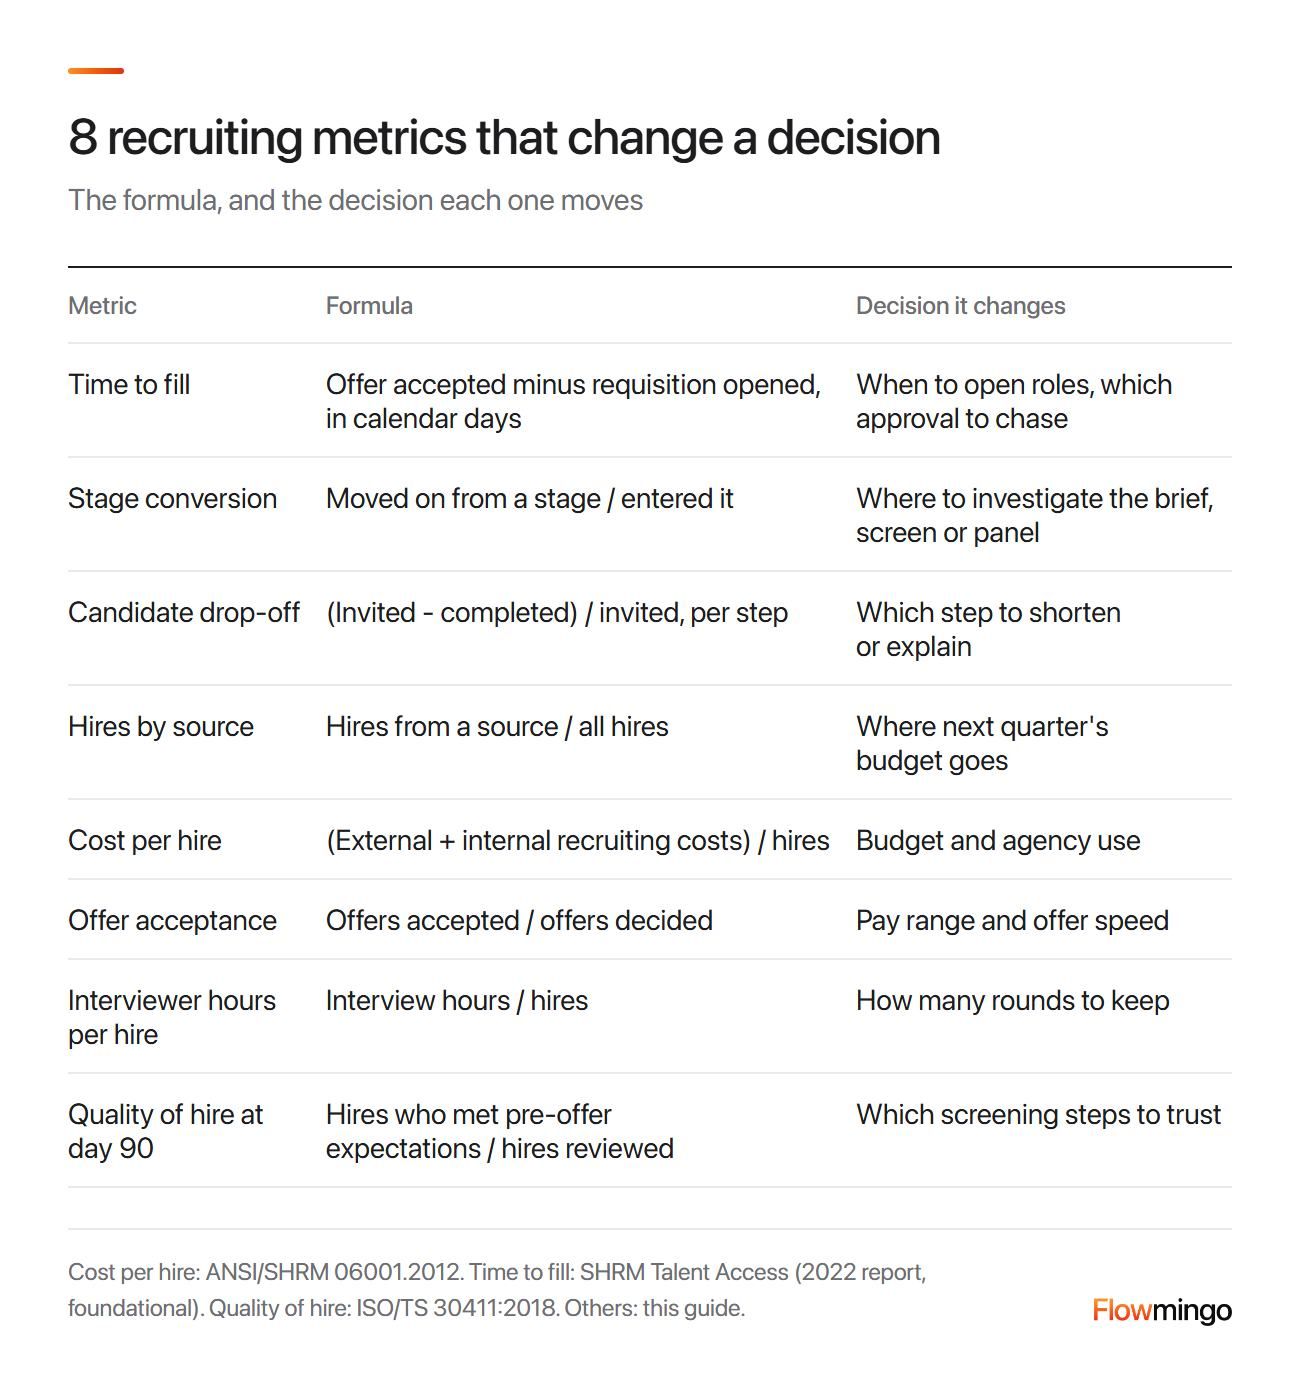
8 recruiting metrics that change a decision: each with its formula and the decision it moves, from time to fill to day-90 quality.
Interviewer hours are on the list because no ranking page counts them. Greenhouse puts average interview hours at 12.3 per hire in North America in 2025. Gem saw interviews per hire rise from 14 in 2021 to 20 in 2024.
1.1 Which recruiting metrics are vanity metrics that leadership should stop asking for?
3 common requests reward effort, not results. A vanity metric rises when a recruiter works harder, even if hires get no better, so swap each for an outcome.
- Applicants per opening becomes the share who meet the bar: 250 applicants sounds healthy, but only 12 reached the final round (4.8%).
- Time to hire alone becomes time to fill plus day-90 quality, because speed without an outcome rewards rushing, a common complaint on r/recruiting.
- Screens per week becomes stage conversion, because 40 screens still sent only 12 (30.0%) to the final round.
2. Should leadership see time to fill or time to hire, and where does each clock start?
Show both, because they answer different questions. Time to fill runs from requisition opened to offer accepted, and time to hire from the hire's application or first contact to offer accepted.
That definition of time to fill comes from SHRM's foundational 2022 Talent Access report, in calendar days. Time to hire has no standard start: AIHR starts when a candidate applies or is approached, and SeekOut at first recruiter contact.
So pick 1 start and keep it all year, or the number moves with the definition.
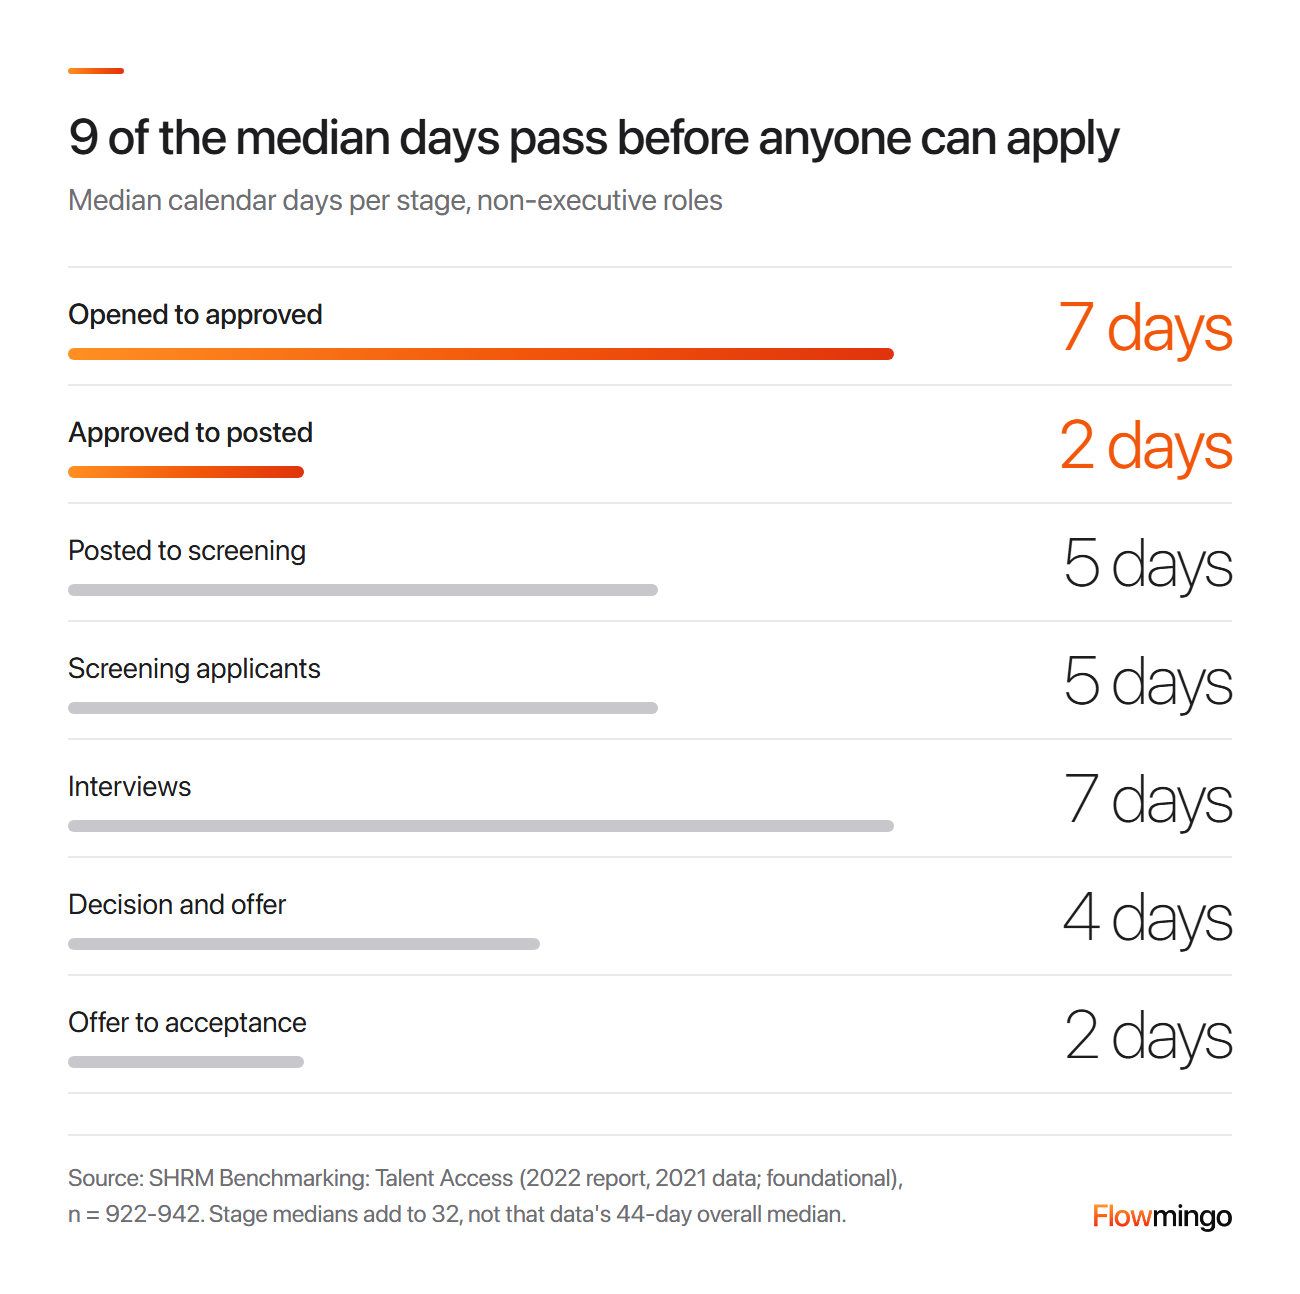
Time to fill by stage: in SHRM's foundational 2021 data, 7 median days to approve and 2 to post pass before anyone can apply.
About 9 days pass before anyone can apply, and only time to fill counts them. Interviews tie for the longest stage, at 7 days.
Those stage medians add to 32 days, not that data's 44-day overall median, because medians do not add. Use the stages to find the slow step, and the overall median to report.
In the worked Customer Success role (illustrative, not customer data), the job went live on day 11 and the hire applied on day 14. A second offer won a yes on day 70, so time to fill is 70 days and time to hire 56.
Put time to fill first, because the business feels the empty seat. Our guide to time to hire shows how to shorten that part.
3. Is our 70-day time to fill too slow, and which recruiting metrics benchmarks can I trust?
Slower than most: SHRM's 2026 benchmark puts the median non-executive time to fill at 39 calendar days. Compare medians with medians, by role family.
SHRM's 2026 benchmarking draws on over 4,600 organisations but publishes only the median. SHRM's quartiles come from its foundational 2021 Talent Access data: 28, 44 and 73 days for non-executive roles.
So the 44 is an older median, not a second 2026 figure. The worked Customer Success role, at 70 days, sits just under that data's 75th percentile of 73.
Greenhouse reports 56.7 days to fill in North America in 2025, without saying if that is a median. Gem's average days to hire rose from 33 in 2021 to 41 in 2024.
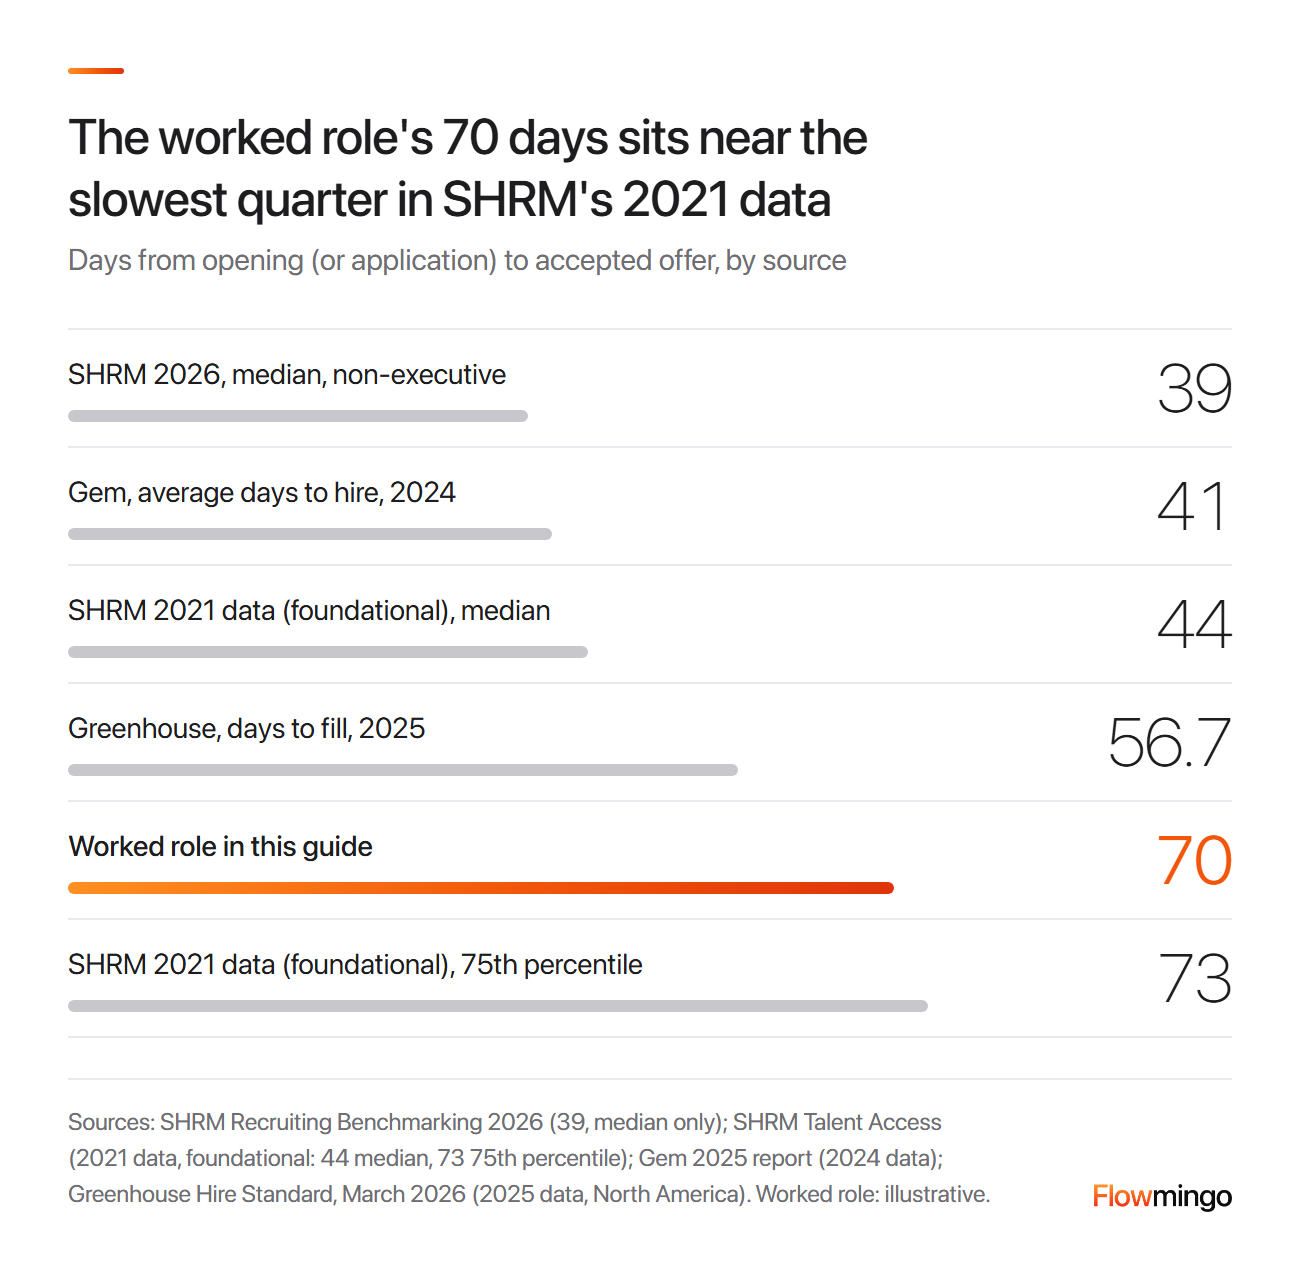
Time to fill benchmarks: SHRM's 2026 median is 39 days and Gem's average days to hire 41. Greenhouse reports 56.7, and the 70-day worked role sits near the 73-day 75th percentile in SHRM's foundational 2021 data.
The chart shows why the clock matters: Gem's 41 is an average of days to hire, not a median time to fill. Check each benchmark's year and sample too, because a vendor's customers are not your market, and 1 stuck role drags an average up.
We found no dated, sourced benchmark for Singapore or wider Asia, so there your own 12-month median by role family is the fairest test.
4. What conversion rate should I expect at each stage of my hiring funnel?
Expect about 6% of inbound applicants to reach a first interview round (Gem's "pre-onsite"), and 20% of those to reach the final round ("onsite"). 35% of finalists got offers in Gem's 2025 report, so roughly 250 applicants made 1 inbound hire (0.4%).
Stage conversion is those who moved on from a stage divided by those who entered it, withdrawals included. Gem's report covers 140M+ applicants through 2024, and 84% of its offers turned into hires. Gem's 2026 report puts offer acceptance at 82%.
The worked role (illustrative, not customer data) converted 16.0%, 30.0%, 16.7% and 50.0% at each step.
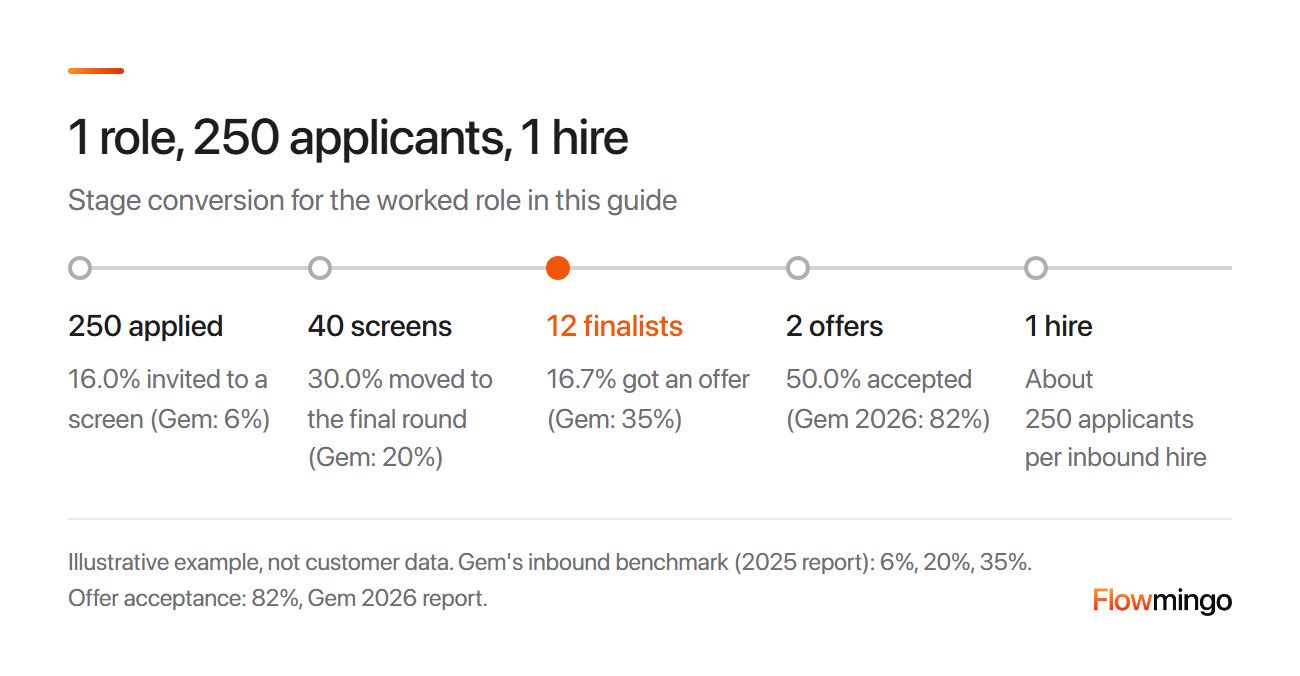
Worked funnel: 250 applicants became 40 screens, 12 finalists, 2 offers and 1 hire, and only 16.7% of finalists got an offer, against Gem's 35%.
At Gem's 6%, 250 applicants would give 15 screens rather than 40: a 12.5-hour difference at 30 minutes each. That is illustrative capacity, not proven waste; role mix and stage definitions differ.
A 16.7% finalist-to-offer rate against 35% prompts investigation, not a diagnosis. Compare matched roles and review the interview scorecard before the next round.
Flowmingo data · about 249,000 applicants · about 10,300 hiring projects · about 5,000 companies · projects created 1 Jul 2025 to 31 Aug 2026 · updated from our shortlisting guide
- 176 was the median hiring-project size by applicant: half of all applicants sat in a project with 176 or more applicants.
- 51.6% of hiring projects with 20 or more scored CVs (about 1,100 projects at about 580 companies, applications 10 Jul to 27 Sep 2026) had no CV scoring 8 or more out of 10.
Applicants counts everyone in a project; many projects are trials. CV scores are AI scores against each job's criteria, not candidate quality or hiring outcomes. The unit is the CV, not the person, and scores from different jobs are not directly comparable.
Half of applicants sat in projects with 176 or more, so a 250-applicant role is ordinary volume. In about half of busier projects no CV reached 8 of 10, so a "screen only 8 and above" rule would screen nobody. Size the screen from interviewer time instead: 40 screens at 30 minutes is 20 hours.
4.1 Should the funnel show pass rates by group, and what threshold do regulators use?
Yes, if you hire in the US, because an unfair step shows first in the funnel. The rule sits in the foundational 1978 Uniform Guidelines, at 29 CFR 1607.4(D). A group's pass rate below 4/5 (80%) of the top group's rate generally counts as evidence of adverse impact.
For example, 30 of 100 applicants in group A pass the screen (30%), against 12 of 60 in group B (20%). 20% divided by 30% is 67%, under 80%, so that step needs a look.
With small numbers a gap may not count, so run a significance test first. This is general information, not legal advice.
5. Where are candidates dropping out of our process, and which recruiting metrics show it?
Count drop-off per step as invited minus completed, divided by invited. In Flowmingo's AI interview figures, most loss comes before the start: 36.3% of invited applicants began, and 85.1% of them finished.
Label every exit, because withdrew and no response are drop-off, while rejected by you is your decision.
Drop-off starts before the application. In Appcast's 2025 report, on US job-ad data, the median apply rate ended 2024 at 6.1% of clicks, and 75.41% of applications came from mobile. So test your form on a phone.
Silence counts too: in Talent Board's foundational 2024 survey, 24% of North American candidates were still waiting 2+ months after applying (Talent Board). So track decisions within 14 days: 195 of 250 (78.0%) in the worked role. Our candidate rejection email templates cover what to send.
In the worked role, 8 of 40 invited screens never finished (20.0%), against 1 of 12 finalists. The screen is the biggest leak, so fix it first. Our post on AI interview drop-off and completion rates covers why applicants leave an interview step.
Flowmingo data · 52,078 applicants invited by recruiters to an AI interview · 866 companies · invites 15 Jun to 13 Sep 2026, each followed for 14 days · Matched Talent invites excluded
- 36.3% of invited applicants began the AI interview within 14 days, and 30.9% finished it.
- 85.1% of applicants who began the AI interview finished it within the 14 days.
- 24.8 hours was the median time from invite to a finished interview, among applicants who finished within 14 days.
- By route (51,447 invites with a known route): 44.2% of applicants whose CV the recruiter added to a hiring project finished.
- 35.8% finished when invited from the recruiter's own contact list, and 17.0% when auto-invited after a job-post application.
- Up to 2 automatic reminder emails, 2 days apart, went to invitees who had not opened the link, the first at about 48 hours.
Counts applicants recruiters invited, not all applicants. Finished means completed, not hired, and 24.8 hours is not time to hire. The routes are associations, not causes: people who sent a CV for this role are more motivated than people contacted from a list. All figures include these reminders, sent only to people who had not opened the link.
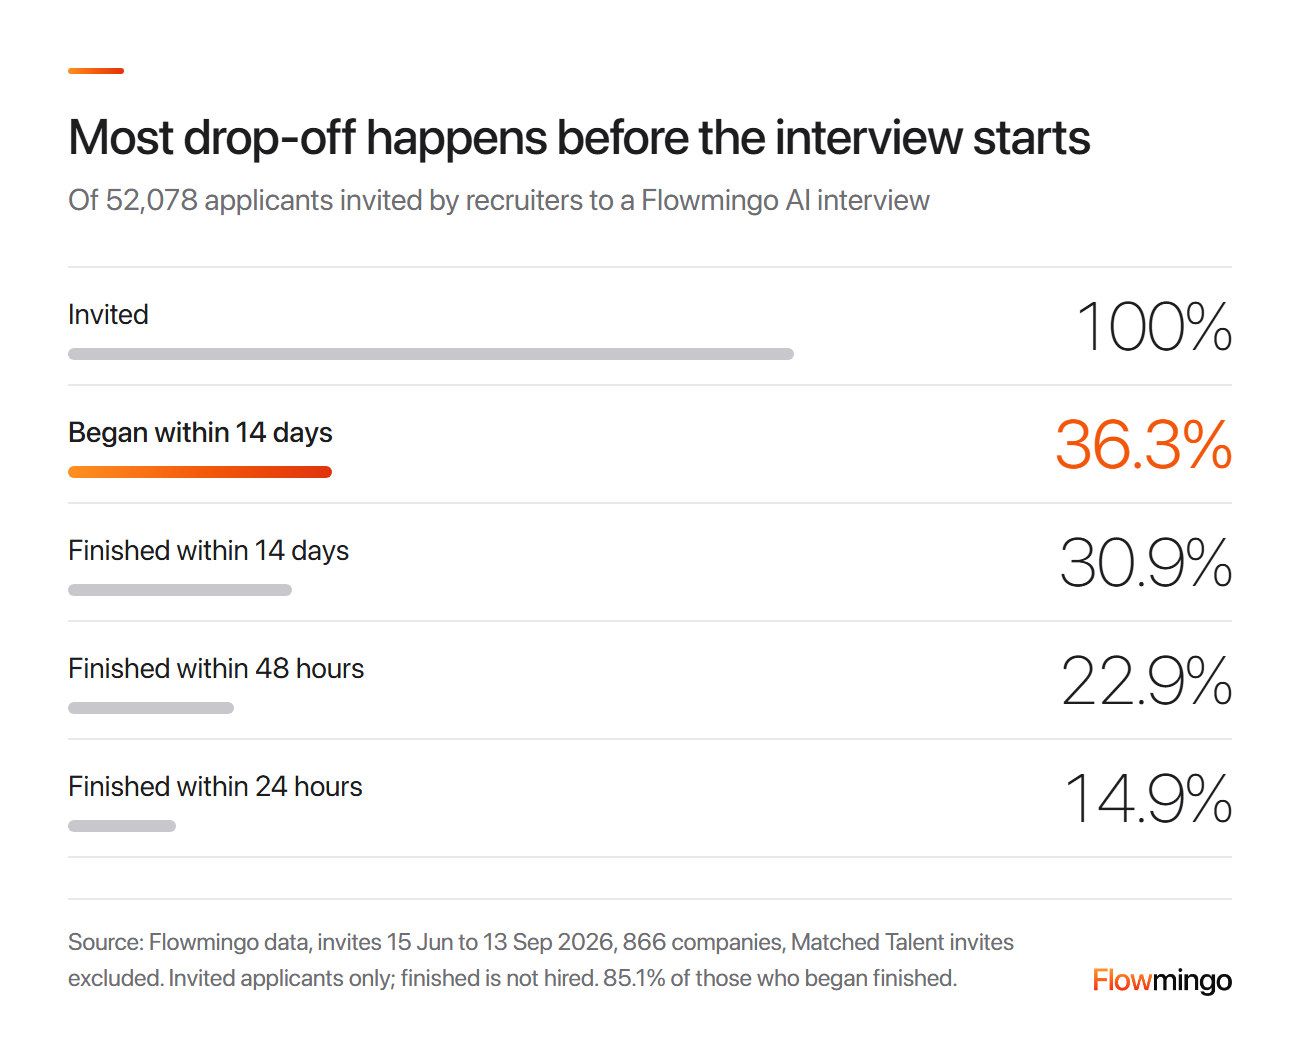
Invite drop-off: of 52,078 invited applicants, 36.3% began within 14 days, so 63.7% never began, and 30.9% finished.
The biggest step down is the first: 63.7% never began. The 48-hour and 24-hour bars (22.9% and 14.9%) are time cuts, not later steps. Of those who finished, 74.3% were done within 48 hours, automatic reminders included.
If your tool sends no reminders, send 1 at about 48 hours and a last nudge on day 5. If it already sends 2, skip yours. If it sends 1, send only the day-5 nudge, so candidates never get the same message twice.
How Flowmingo helps
If you screen with Chat Screening before the interview, its started and completed counts give that step's drop-off line. You can resend the invite to anyone who has not started. Applicants then do the AI interview in their own time.
6. How do I track source of hire when candidates come from 5 different job boards?
Give every applicant 1 source from a fixed list on entry, then report hires by source beside applicants by source.
Source share of hires is hires from a source divided by all hires, and source yield is hires divided by applicants from that source.
In Gem's 2025 report, referrals made 1.64% of applications but 17.09% of hires. Internal candidates made 0.27% and 12.56%, and direct sourcing 2.47% and 9.94%.
Job boards and sourcing sites made 48.98% of applications and 24.55% of hires. Company marketing made 41.12% and 25.60%.
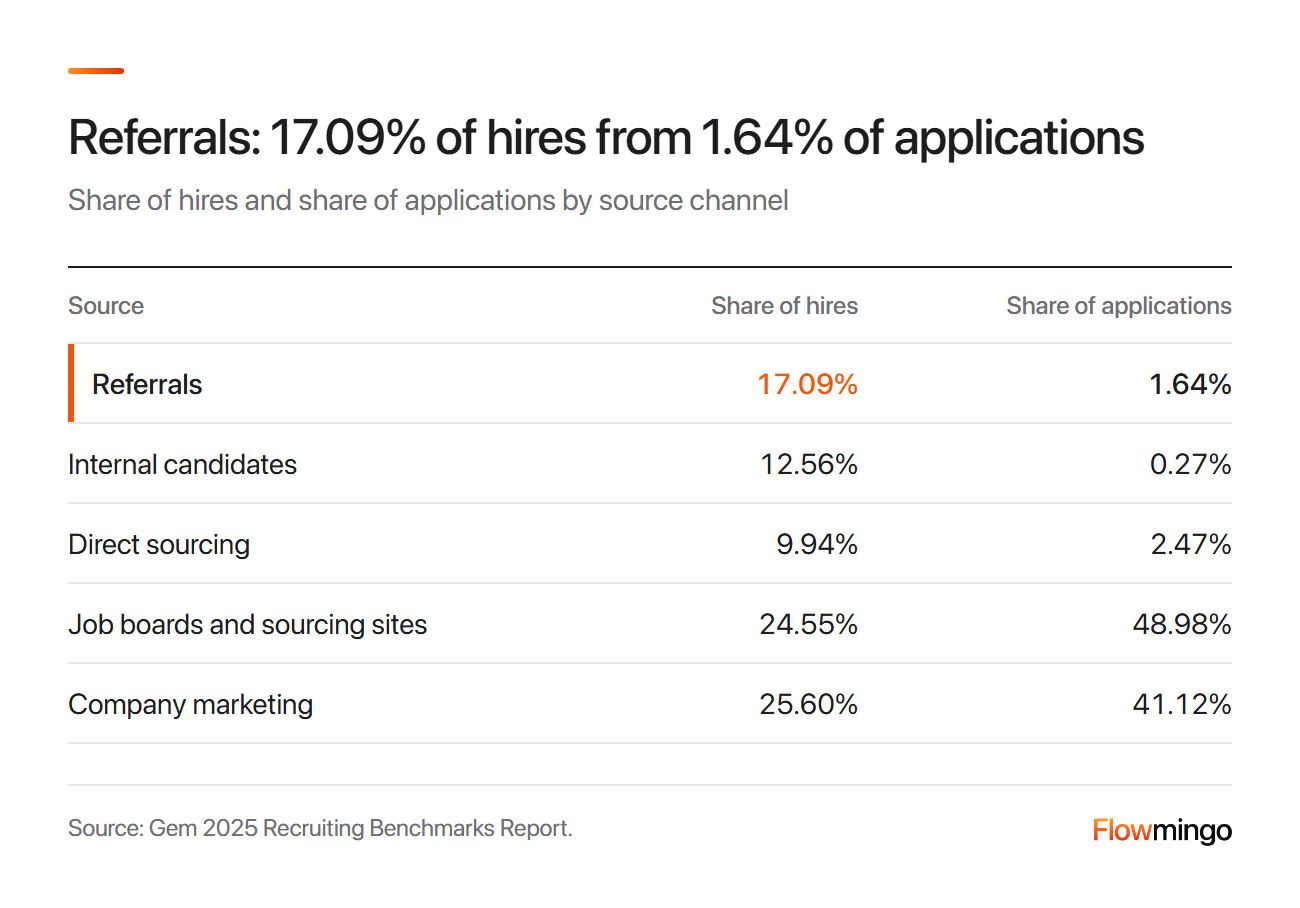
Source of hire in pairs: in Gem's data, referrals made 1.64% of applications but 17.09% of hires, while job boards made 48.98% and 24.55%.
Referrals also stay. In a foundational 2015 study of 9 large firms, Burks and colleagues found referred hires substantially less likely to quit. So add retention by source once a year.
Tagging 5 boards needs no integration, just 3 rules:
- Give each board its own tracked link with a utm_source.
- Keep 1 Source column with 6 to 8 fixed values, because free text splits 1 source into many spellings of LinkedIn.
- Let the first touch win, so a re-applicant counts once.
The worked quarter (illustrative, not customer data):
| Source | Applicants | Hires | Yield (hires / applicants) |
|---|---|---|---|
| Job boards | 520 (57.8%) | 1 | 0.2% |
| Careers page | 270 (30.0%) | 1 | 0.4% |
| Referrals | 40 (4.4%) | 2 | 5.0% |
| Agency | 10 (1.1%) | 1 | 10.0% |
| LinkedIn sourcing | 60 (6.7%) | 0 | 0% |
Referrals bring 2 of the 5 hires from 40 of 900 applicants, a 5.0% yield against 0.2% for job boards. 0 hires from LinkedIn sourcing in 1 quarter is too few to cut it, so judge it over a year.
7. How do I calculate cost per hire the SHRM way, and why is ours so high?
Add external costs (ads, agencies, candidate travel) to internal costs (recruiter pay, hiring systems), then divide by hires in the same period. That is ANSI/SHRM 06001.2012, a foundational 2012 standard behind SHRM's benchmarks.
The worked quarter, with 5 hires (illustrative, not customer data):
| Line | Bucket | Amount |
|---|---|---|
| Job boards, 1 agency fee, candidate travel | External | $12,000 |
| Recruiter pay and benefits, a quarter of $90,000 | Internal | $22,500 |
| Head of TA, half their time for a quarter | Internal | $15,000 |
| ATS and assessment tools | Internal | $1,200 |
| Referral bonuses, 2 x $1,000 | Internal | $2,000 |
| Cost per hire: $52,700 / 5 hires | $10,540 |
We put referral bonuses in internal because you pay them to your own staff.
Report interviewer time beside the number, not inside it: 27 finalists each met 3 interviewers for 1 hour, or 16.2 hours per hire.
Pay and tools ($38,700) are 73% of the quarter, so 5 hires carry $7,740 each before a single ad.
The same team making 60 hires a year would carry $2,580 each. So a quiet quarter raises cost per hire without new spending, and a rolling 12 months belongs beside it.
SHRM's foundational 2021 data, from 472 organisations, put the median cost per hire at $1,244 and the average at $4,683. The 25th percentile was $354 and the 75th $4,375, so SHRM says to use the median.
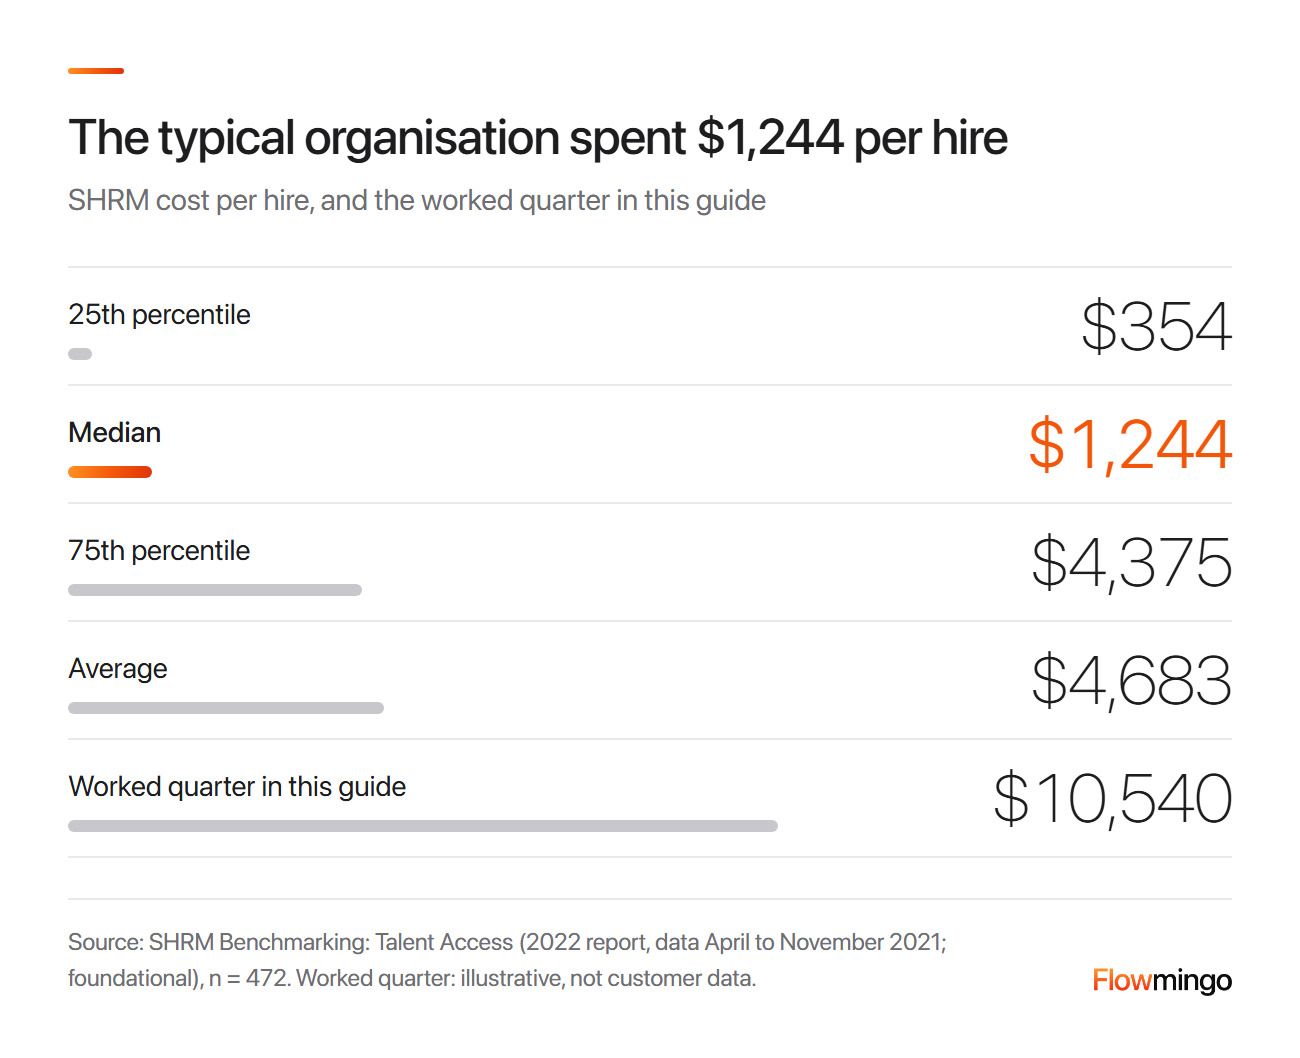
Cost per hire spread: SHRM's median was $1,244 and its average $4,683, while the worked quarter in this guide reached $10,540.
The worked quarter's $10,540 is more than double SHRM's 75th percentile. Without fixed pay and tools, the spend you can change is $14,000, or $2,800 per hire, between the median and the 75th percentile.
Keep ad-only numbers out of your recruiting metrics. Appcast's $851 median at the end of 2024 counts advertising dollars only. In the UK, CIPD's foundational 2024 median was £1,500 for roles below senior manager, from employers' own estimates.
8. What offer acceptance rate is normal now, and what does a low one tell me?
Divide offers accepted by offers made, counting each offer in the month the candidate answers. Gem's 2026 report puts the rate at 82%, so a rate well under 80% deserves a look at every decline.
Leave open and rescinded offers out, because neither is a candidate's answer. In its 2025 report, the share of Gem's offers that became hires rose from 81% in 2021 to 84% in 2024.
SHRM's foundational 2021 median was 100%, so at a typical firm 1 decline swings the rate. Gartner found 48% of candidates accepted their most recent offer in 4Q25, down from 85% in 4Q23.
Gartner surveys candidates, not employers. Someone weighing 2 offers turns 1 down, so its 48% is not your acceptance rate.
In Greenhouse's foundational 2024 candidate report, US candidates rejecting job offers named salary below expectations (46%) and a better offer elsewhere (29%) most.
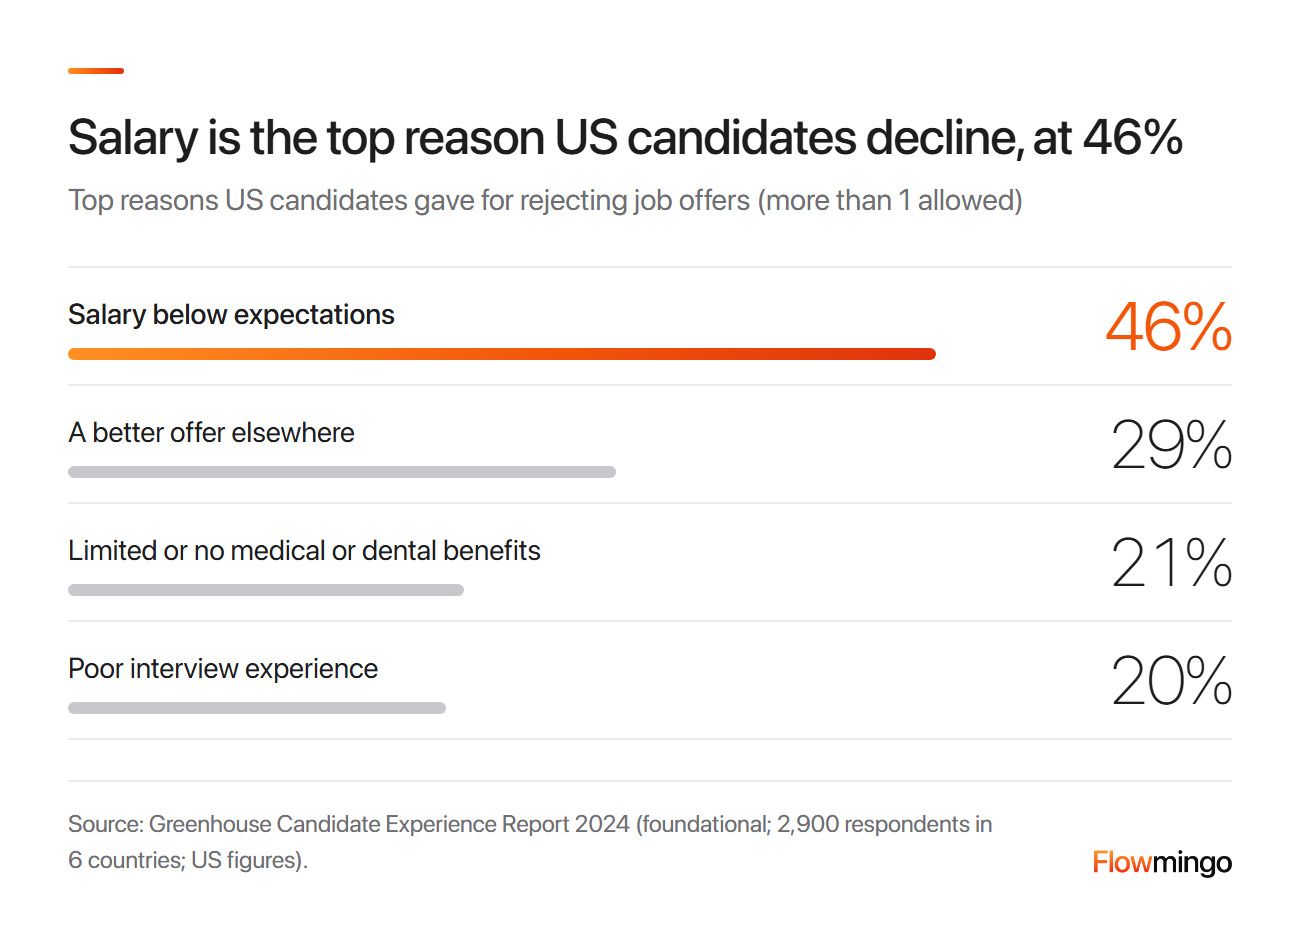
Offer decline reasons: US candidates rejecting offers named salary below expectations (46%) and a better offer elsewhere (29%) most. More than 1 reason allowed.
Salary leads, but 20% blamed a poor interview experience, which you can fix. Limited or no medical or dental benefits (21%) come next, so put benefits in writing before the offer.
Log 1 reason per decline from a fixed list, and agree the pay range at the first screen.
In a foundational 2010 study of 3,012 candidates at 1 large company, Becker and colleagues found faster offers won more acceptances. Later performance and retention did not drop.
In the worked role, 7 days passed from final interview to offer, against SHRM's foundational 2021 median of 4 for decision and offer. The quarter's 5 of 6 (83.3%) sits close to Gem's 82%.
9. How do I measure quality of hire honestly with only 10 to 20 hires a year?
Write down what good looks like before the offer, then check each hire against it at day 90, and report retention separately. Show counts, and read the trend yearly.
A standard exists. ISO/TS 30411:2018, a foundational 2018 text, compares performance after hire with expectations set before it, and leaves retention out.
Few teams measure it: in SHRM's foundational 2021 data, 27% of organisations did.
Turn 3 to 5 must-haves from the interview scorecard into written expectations at the offer. At day 90, the hiring manager marks each met, partly met or not met, with evidence.
| Expectation written before the offer | Day 90 | Interview score |
|---|---|---|
| Runs renewals for 40 accounts by day 60 | Met | 8 |
| Updates CRM notes weekly (a should-have) | Partly | 6 |
The worked team (illustrative, not customer data) made 16 hires in 12 months. 1 left before day 90, so 15 were reviewed: 12 met expectations (80%) and 3 did not. 3 of 15 is 20%, but the true rate could sit anywhere from about 7% to 45%.
That range is our own arithmetic on 15 people, and 1 person moves the rate by about 7 points. So show counts, because a trend line would mostly show noise.
Then put interview scores beside day-90 results. In a foundational 2022 re-analysis by Sackett and colleagues, structured interviews predicted performance about twice as well as unstructured ones.
Our rule of thumb: judge that link for your recruiting metrics after 20 or more hires. Our structured interview guide and post on how to measure quality of hire go deeper.
Flowmingo data · 52,078 applicants invited by recruiters to an AI interview at 866 companies · 16,057 scored interviews at 487 of them · invites 15 Jun to 13 Sep 2026 · the same cohort as section 5
- 5.2% of the 16,057 scored AI interviews scored 8 or more out of 10 against each job's own weighted criteria.
- 1.6% of all 52,078 invited applicants, about 1 in 63, had an AI interview scoring 8 or more within 14 days.
AI interview scores against each job's own criteria, not job performance or hiring outcomes. Scores from different jobs are not directly comparable, and interviews the AI could not evaluate are left out. Only day-90 results show whether a score predicted anything.
10. What should a 1-page monthly recruiting metrics dashboard for the CEO include?
Use 1 table of the 8 metrics, each line with its result and period, a dated benchmark and the decision you want. Put the 1-line conclusion above it.
A page of decisions gets read because each line asks for something. In a foundational 2023 r/recruiting post, a solo recruiter doubted anyone read the weekly stats email to the C-suite.
Open with it, for example: "On plan for 5 hires this quarter. 2 roles are stuck in approval, and cost per hire is high because 73% is fixed pay and tools."
Send it monthly and name each line's period, because at 5 hires a quarter most lines need the full quarter.
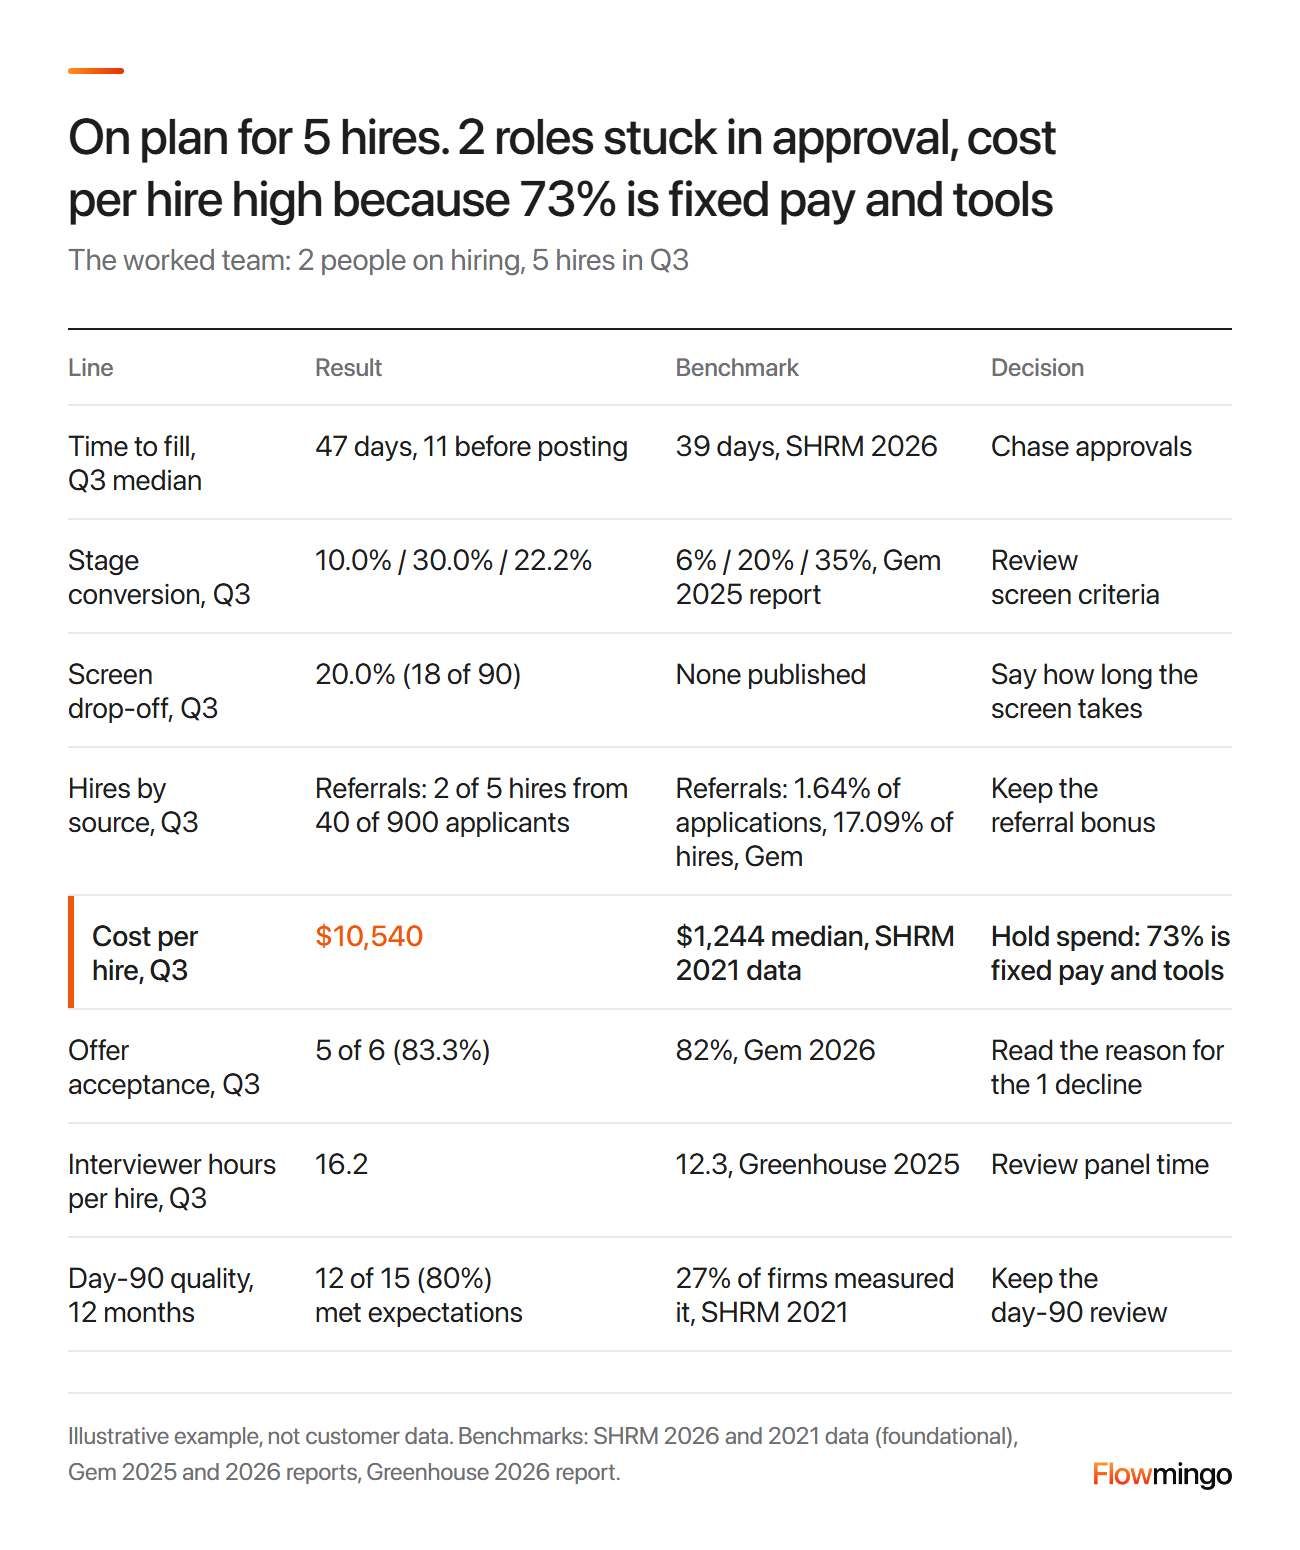
CEO dashboard: 8 lines, each with its period, a dated benchmark and a decision, led by a $10,540 cost per hire against SHRM's $1,244 median.
3 lines need the CEO's decision this month. Median time to fill across Q3's 5 hires is 47 days against SHRM's 2026 median of 39, with 11 before posting, so chase approvals. Cost per hire is $10,540, but 73% is fixed pay and tools, so hold spend rather than cut channels.
Interviewer hours per hire are 16.2 against Greenhouse's 12.3; check comparable roles, stage definitions and outcomes before cutting rounds. The figure shows the rest: stage conversion of 10.0%, 30.0% and 22.2%, and a screen drop-off of 18 of 90, with no published benchmark.
10.1 How do I track recruiting metrics in a spreadsheet when our ATS can't report?
Use 1 row per candidate per role for the 4 formulas below. First filter to the reporting cohort: offer-acceptance dates for hires, offer-decision dates for acceptance, and a fixed application cohort for stage conversion.
| Column | What goes in |
|---|---|
| Role, candidate, source | IDs and 1 fixed source |
| Dates | Requisition opened, posted, applied, offer, offer decision, offer accepted, start |
| Furthest stage | 1 applied, 2 screen, 3 final, 4 offer, 5 accepted |
| Outcome | Hired, rejected, withdrew, no response, declined offer, offer open, rescinded |
| Decline reason (fixed list) | Such as salary |
| Day-90 result | Met, partly, not met |
Name the filtered column ranges before using these formulas. Screen drop-off needs invitation/completion events.
Interviewer hours need attendance logs, and cost per hire needs a dated cost ledger.
- Time to fill: add a helper column TTF = OfferAccepted-ReqOpened, then =MEDIAN(FILTER(TTF,Outcome="hired")).
- Stage conversion: =COUNTIFS(Role,"CSM-01",Stage,">=3")/COUNTIFS(Role,"CSM-01",Stage,">=2").
- Offer acceptance: =COUNTIFS(Stage,">=5")/(COUNTIFS(Stage,">=4")-COUNTIFS(Stage,4,Outcome,"offer open")-COUNTIFS(Stage,4,Outcome,"rescinded")). Declined offers stay in, because a no is an answer.
- Hires by source: =COUNTIFS(Source,"Referral",Outcome,"hired").
How Flowmingo helps
Flowmingo does not build this dashboard for you. Every assessment a candidate completes lands on 1 profile, in 1 board with custom stages. Signed webhooks send invitation, assessment and evaluation events to your own systems, such as the automation that fills your recruiting metrics sheet. Flowmingo is a free AI interviewer for recruiters.
11. Sources
Every study, standard and survey in this guide links to a source below; Flowmingo figures come from Flowmingo's own platform data.
- American National Standards Institute and Society for Human Resource Management (2012). Cost-per-hire (ANSI/SHRM 06001.2012). Standard, reproduction.
- Appcast (2025). 2025 recruitment marketing benchmark report: U.S. edition. Appcast.
- Becker, W. J., Connolly, T., & Slaughter, J. E. (2010). The effect of job offer timing on offer acceptance, performance, and turnover. Personnel Psychology, 63(1), 223-241.
- Burks, S. V., Cowgill, B., Hoffman, M., & Housman, M. (2015). The value of hiring through employee referrals. The Quarterly Journal of Economics, 130(2), 805-839.
- CIPD (2024). Resourcing and talent planning report 2024. Chartered Institute of Personnel and Development.
- Gartner (2026, June 18). Gartner HR research finds 48% of candidates accepted job offers in 4Q25. Gartner newsroom.
- Gem (2025). 2025 recruiting benchmarks report. Gem.
- Gem (2025, December 1). Key takeaways from the 2026 recruiting benchmarks report. Gem.
- Greenhouse (2024). Greenhouse candidate experience report 2024. Greenhouse.
- Greenhouse (2026). The Hire Standard: Greenhouse benchmark report, North America. Greenhouse.
- International Organization for Standardization (2018). Human resource management: Quality of hire metric (ISO/TS 30411:2018). Preview.
- Recruiterflow (n.d., read 2026). 25 recruitment metrics to track in 2026. Recruiterflow blog.
- Sackett, P. R., Zhang, C., Berry, C. M., & Lievens, F. (2022). Revisiting meta-analytic estimates of validity in personnel selection: Addressing systematic overcorrection for restriction of range. Journal of Applied Psychology, 107(11), 2040-2068.
- SeekOut (2026, March 11). Why recruiting metrics matter in 2026: The cheat sheet for TA leaders. SeekOut.
- Society for Human Resource Management (2022). SHRM benchmarking: Talent access. SHRM.
- Society for Human Resource Management (2026). Recruiting executives benchmarking. SHRM.
- Talent Board (2024, December). What sets CandE award winners apart: 2024 CandE benchmark research. ERE Media.
- U.S. Equal Employment Opportunity Commission and others (1978). Uniform guidelines on employee selection procedures, 29 CFR 1607.4: Information on impact. Legal Information Institute, Cornell Law School.
- van Vulpen, E. (2026, July 21). 23 recruiting metrics you should know. AIHR.